29
/
en
AIzaSyAYiBZKx7MnpbEhh9jyipgxe19OcubqV5w
April 1, 2024
228764
Romania
ROU
true
2
1
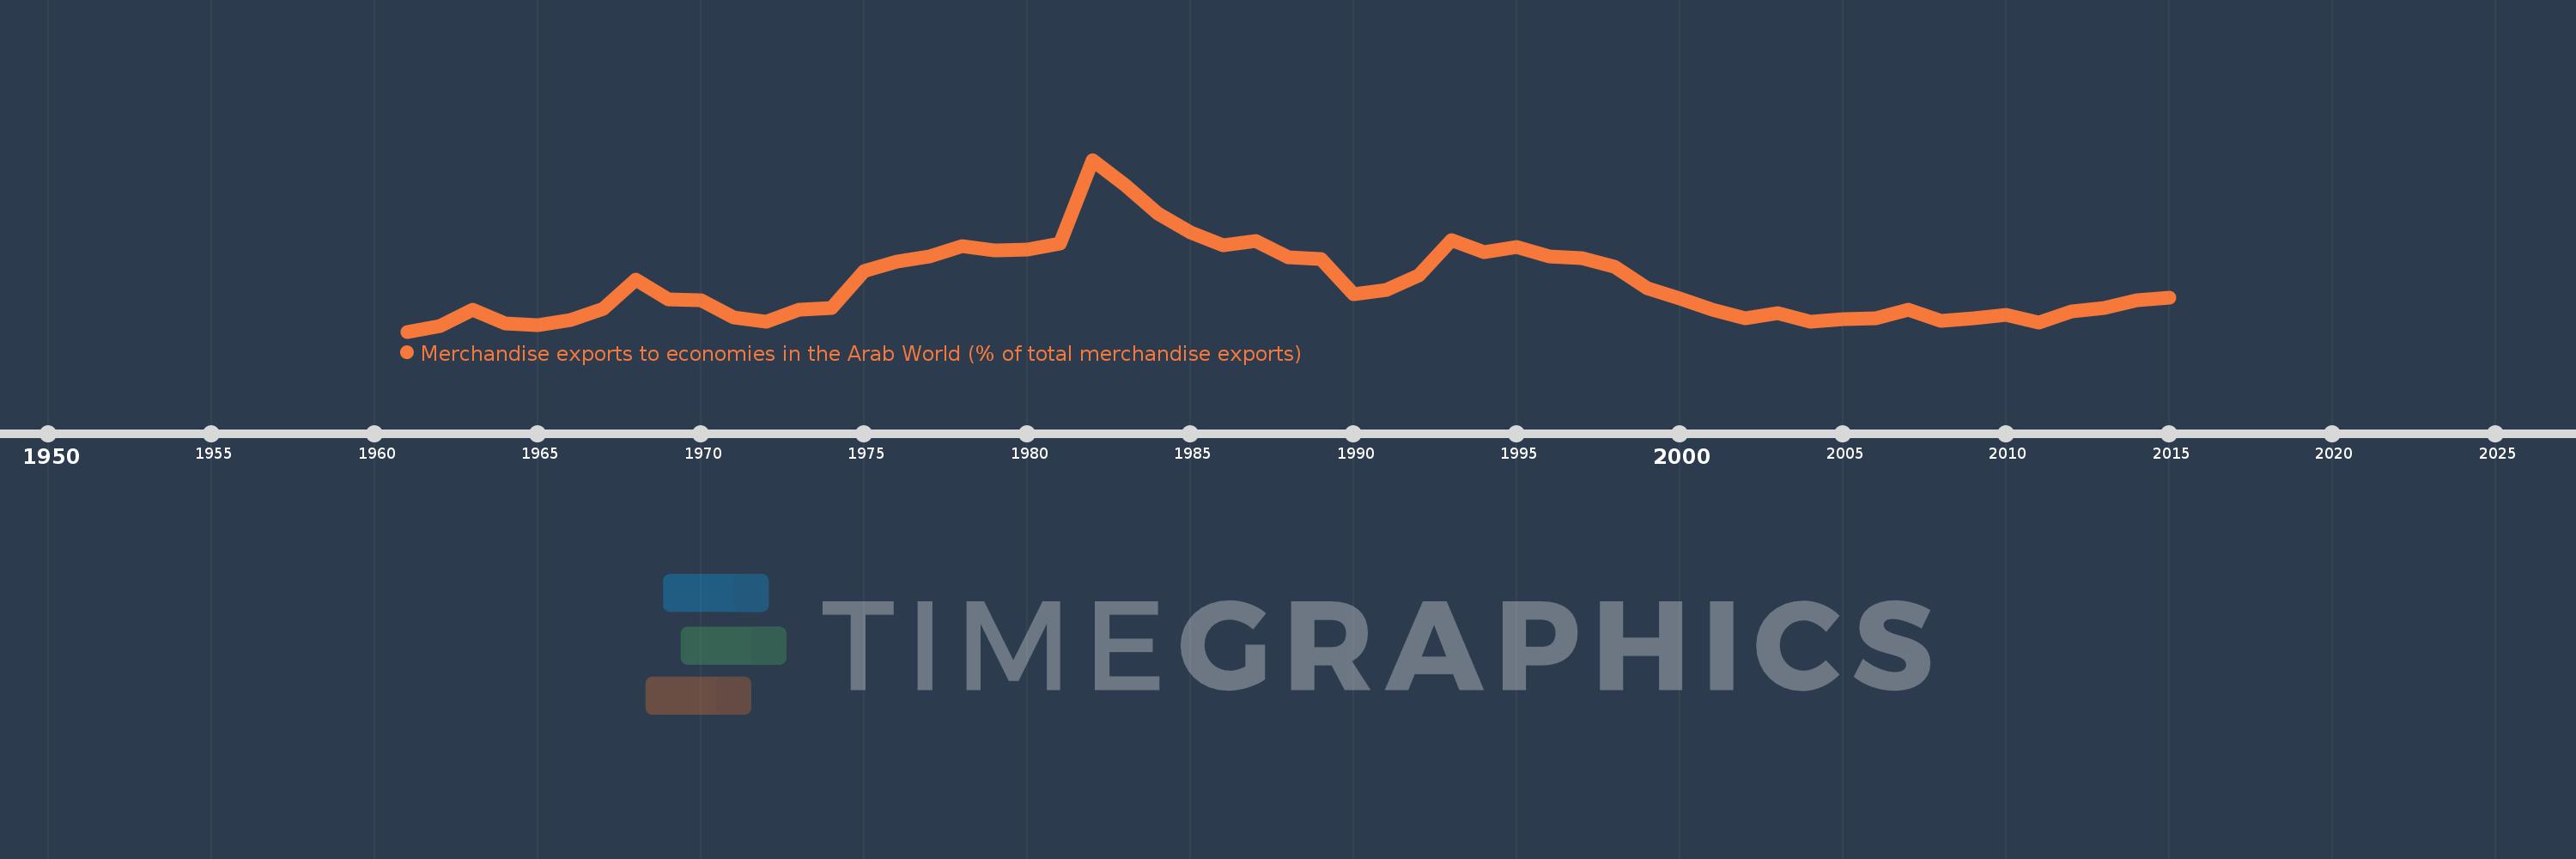
Merchandise exports to economies in the Arab World (% of total merchandise exports)
2015,2014,2013,2012,2011,2010,2009,2008,2007,2006,2005,2004,2003,2002,2001,2000,1999,1998,1997,1996,1995,1994,1993,1992,1991,1990,1989,1988,1987,1986,1985,1984,1983,1982,1981,1980,1979,1978,1977,1976,1975,1974,1973,1972,1971,1970,1969,1968,1967,1966,1965,1964,1963,1962,1961
This statistics in other country:
AfghanistanAlbaniaAlgeriaAngolaArab WorldArgentinaArmeniaArubaAustraliaAustriaAzerbaijanBahamas, TheBahrainBangladeshBarbadosBelarusBelgiumBelizeBeninBermudaBoliviaBosnia and HerzegovinaBrazilBrunei DarussalamBulgariaBurkina FasoBurundiCabo VerdeCambodiaCameroonCanadaCaribbean small statesCentral African RepublicCentral Europe and the BalticsChadChileChinaColombiaComorosCongo, Dem. Rep.Congo, Rep.Costa RicaCote d'IvoireCroatiaCubaCyprusCzech RepublicDenmarkDjiboutiDominicaDominican RepublicEarly-demographic dividendEast Asia & PacificEast Asia & Pacific (excluding high income)East Asia & Pacific (IDA & IBRD countries)EcuadorEgypt, Arab Rep.El SalvadorEstoniaEthiopiaEuro areaEurope & Central AsiaEurope & Central Asia (excluding high income)Europe & Central Asia (IDA & IBRD countries)European UnionFijiFinlandFragile and conflict affected situationsFranceGabonGambia, TheGeorgiaGermanyGhanaGreeceGreenlandGrenadaGuatemalaGuineaGuinea-BissauGuyanaHaitiHeavily indebted poor countries (HIPC)High incomeHondurasHong Kong SAR, ChinaHungaryIBRD onlyIcelandIDA & IBRD totalIDA blendIDA onlyIDA totalIndiaIndonesiaIran, Islamic Rep.IraqIrelandIsraelItalyJamaicaJapanJordanKazakhstanKenyaKorea, Dem. People’s Rep.Korea, Rep.KosovoKuwaitKyrgyz RepublicLao PDRLate-demographic dividendLatin America & Caribbean Latin America & Caribbean (excluding high income)Latin America & the Caribbean (IDA & IBRD countries)LatviaLeast developed countries: UN classificationLebanonLiberiaLibyaLithuaniaLow & middle incomeLow incomeLower middle incomeLuxembourgMacao SAR, ChinaMacedonia, FYRMadagascarMalawiMalaysiaMaldivesMaliMaltaMauritaniaMauritiusMexicoMiddle East & North AfricaMiddle East & North Africa (excluding high income)Middle East & North Africa (IDA & IBRD countries)Middle incomeMoldovaMongoliaMontenegroMoroccoMozambiqueMyanmarNepalNetherlandsNew CaledoniaNew ZealandNicaraguaNigerNigeriaNorth AmericaNorwayOECD membersOmanOther small statesPacific island small statesPakistanPanamaPapua New GuineaParaguayPeruPhilippinesPolandPortugalPost-demographic dividendPre-demographic dividendQatarRomaniaRussian FederationRwandaSamoaSaudi ArabiaSenegalSerbiaSeychellesSierra LeoneSingaporeSlovak RepublicSloveniaSmall statesSomaliaSouth AfricaSouth AsiaSouth Asia (IDA & IBRD)SpainSri LankaSt. LuciaSt. Vincent and the GrenadinesSub-Saharan Africa Sub-Saharan Africa (excluding high income)Sub-Saharan Africa (IDA & IBRD countries)SudanSurinameSwedenSwitzerlandSyrian Arab RepublicTajikistanTanzaniaThailandTogoTrinidad and TobagoTunisiaTurkeyTurkmenistanUgandaUkraineUnited Arab EmiratesUnited KingdomUnited StatesUpper middle incomeUruguayUzbekistanVenezuela, RBVietnamWorldYemen, Rep.ZambiaZimbabwe Timeline:
This timeline shows a graph from 1961 to 2015 of Romania. No data until 1960. Number of actual observations by date: 55.
Source name:
World Development Indicators
Source organization:
World Bank staff estimates based data from International Monetary Fund's Direction of Trade database.
Categories, topics:
Private Sector, Trade
Last updated:
apr 23, 2017
Indicators value changes by year
Maximum:
18.392
jan 1, 1982
At the date of observation
Value
Absolute change
Change from previous value
jan 1, 1961
2.909
+2.909
0.0%
jan 1, 1962
3.416
+0.508
17.45%
jan 1, 1963
4.904
+1.488
43.55%
jan 1, 1964
3.629
-1.275
-26.01%
jan 1, 1965
3.513
-0.115
-3.18%
jan 1, 1966
3.924
+0.411
11.69%
jan 1, 1967
4.929
+1.006
25.63%
jan 1, 1968
7.581
+2.651
53.78%
jan 1, 1969
5.848
-1.733
-22.86%
jan 1, 1970
5.713
-0.135
-2.31%
jan 1, 1971
4.194
-1.518
-26.58%
jan 1, 1972
3.816
-0.379
-9.03%
jan 1, 1973
4.849
+1.033
27.07%
jan 1, 1974
5.01
+0.161
3.32%
jan 1, 1975
8.381
+3.371
67.29%
jan 1, 1976
9.183
+0.802
9.57%
jan 1, 1977
9.692
+0.51
5.55%
jan 1, 1978
10.632
+0.94
9.7%
jan 1, 1979
10.201
-0.431
-4.06%
jan 1, 1980
10.314
+0.114
1.11%
jan 1, 1981
10.845
+0.53
5.14%
jan 1, 1982
18.392
+7.547
69.59%
jan 1, 1983
16.091
-2.301
-12.51%
jan 1, 1984
13.575
-2.515
-15.63%
jan 1, 1985
11.843
-1.732
-12.76%
jan 1, 1986
10.718
-1.125
-9.5%
jan 1, 1987
11.093
+0.375
3.5%
jan 1, 1988
9.644
-1.448
-13.06%
jan 1, 1989
9.485
-0.159
-1.65%
jan 1, 1990
6.312
-3.173
-33.45%
jan 1, 1991
6.677
+0.365
5.78%
jan 1, 1992
8.014
+1.337
20.03%
jan 1, 1993
11.171
+3.156
39.39%
jan 1, 1994
10.094
-1.077
-9.64%
jan 1, 1995
10.541
+0.447
4.43%
jan 1, 1996
9.649
-0.892
-8.47%
jan 1, 1997
9.566
-0.082
-0.85%
jan 1, 1998
8.753
-0.813
-8.5%
jan 1, 1999
6.793
-1.96
-22.39%
jan 1, 2000
5.899
-0.894
-13.16%
jan 1, 2001
4.863
-1.036
-17.57%
jan 1, 2002
4.095
-0.768
-15.79%
jan 1, 2003
4.581
+0.485
11.85%
jan 1, 2004
3.776
-0.805
-17.57%
jan 1, 2005
4.004
+0.229
6.05%
jan 1, 2006
4.146
+0.142
3.55%
jan 1, 2007
4.876
+0.73
17.6%
jan 1, 2008
3.908
-0.968
-19.85%
jan 1, 2009
4.09
+0.182
4.66%
jan 1, 2010
4.418
+0.328
8.01%
jan 1, 2011
3.747
-0.67
-15.17%
jan 1, 2012
4.698
+0.95
25.36%
jan 1, 2013
5.02
+0.322
6.86%
jan 1, 2014
5.698
+0.677
13.49%
jan 1, 2015
5.961
+0.264
4.63%
Ranking of countries by current statistics by years


Comments: