29
/
en
AIzaSyAYiBZKx7MnpbEhh9jyipgxe19OcubqV5w
April 1, 2024
31812
Europe & Central Asia (excluding high income)
ECA
false
2
1
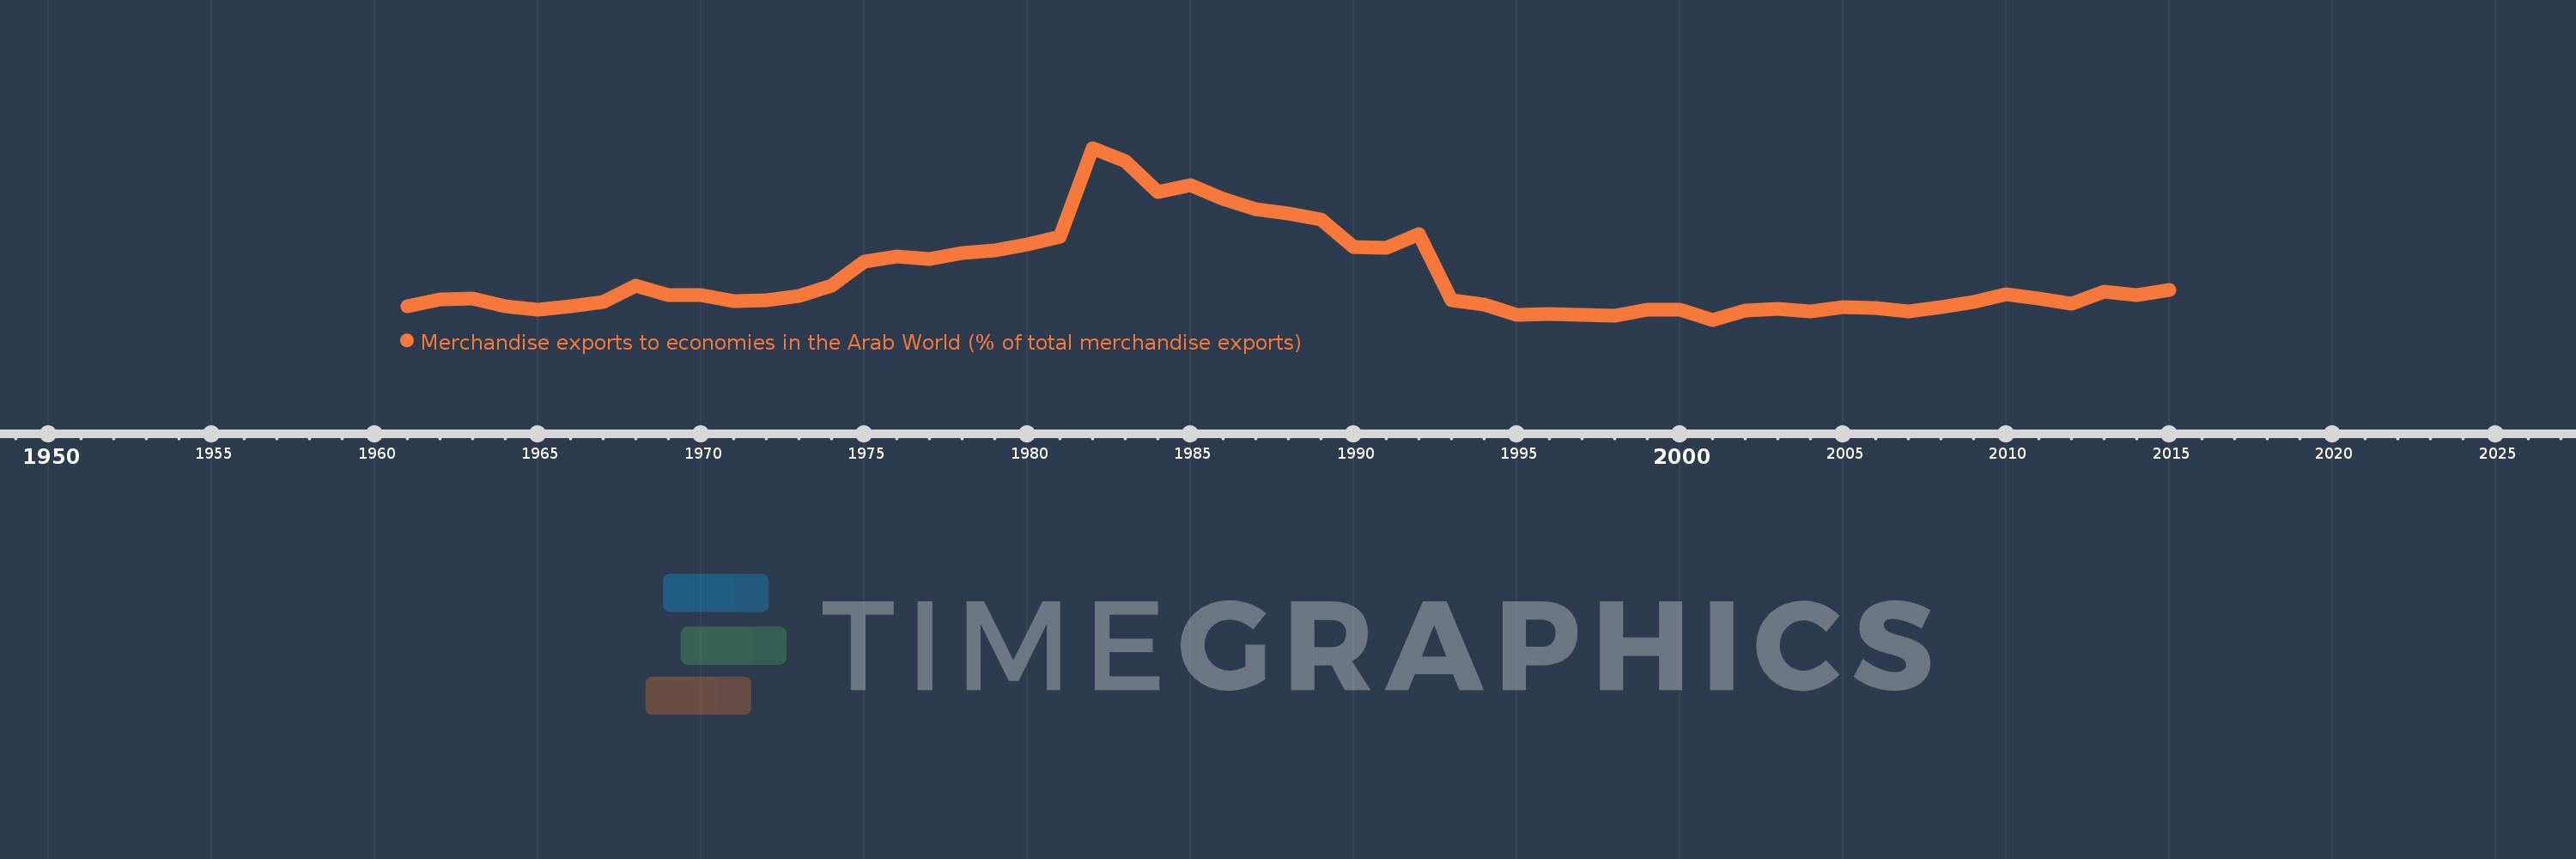
Merchandise exports to economies in the Arab World (% of total merchandise exports)
2015,2014,2013,2012,2011,2010,2009,2008,2007,2006,2005,2004,2003,2002,2001,2000,1999,1998,1997,1996,1995,1994,1993,1992,1991,1990,1989,1988,1987,1986,1985,1984,1983,1982,1981,1980,1979,1978,1977,1976,1975,1974,1973,1972,1971,1970,1969,1968,1967,1966,1965,1964,1963,1962,1961
This statistics in other country:
AfghanistanAlbaniaAlgeriaAngolaArab WorldArgentinaArmeniaArubaAustraliaAustriaAzerbaijanBahamas, TheBahrainBangladeshBarbadosBelarusBelgiumBelizeBeninBermudaBoliviaBosnia and HerzegovinaBrazilBrunei DarussalamBulgariaBurkina FasoBurundiCabo VerdeCambodiaCameroonCanadaCaribbean small statesCentral African RepublicCentral Europe and the BalticsChadChileChinaColombiaComorosCongo, Dem. Rep.Congo, Rep.Costa RicaCote d'IvoireCroatiaCubaCyprusCzech RepublicDenmarkDjiboutiDominicaDominican RepublicEarly-demographic dividendEast Asia & PacificEast Asia & Pacific (excluding high income)East Asia & Pacific (IDA & IBRD countries)EcuadorEgypt, Arab Rep.El SalvadorEstoniaEthiopiaEuro areaEurope & Central AsiaEurope & Central Asia (excluding high income)Europe & Central Asia (IDA & IBRD countries)European UnionFijiFinlandFragile and conflict affected situationsFranceGabonGambia, TheGeorgiaGermanyGhanaGreeceGreenlandGrenadaGuatemalaGuineaGuinea-BissauGuyanaHaitiHeavily indebted poor countries (HIPC)High incomeHondurasHong Kong SAR, ChinaHungaryIBRD onlyIcelandIDA & IBRD totalIDA blendIDA onlyIDA totalIndiaIndonesiaIran, Islamic Rep.IraqIrelandIsraelItalyJamaicaJapanJordanKazakhstanKenyaKorea, Dem. People’s Rep.Korea, Rep.KosovoKuwaitKyrgyz RepublicLao PDRLate-demographic dividendLatin America & Caribbean Latin America & Caribbean (excluding high income)Latin America & the Caribbean (IDA & IBRD countries)LatviaLeast developed countries: UN classificationLebanonLiberiaLibyaLithuaniaLow & middle incomeLow incomeLower middle incomeLuxembourgMacao SAR, ChinaMacedonia, FYRMadagascarMalawiMalaysiaMaldivesMaliMaltaMauritaniaMauritiusMexicoMiddle East & North AfricaMiddle East & North Africa (excluding high income)Middle East & North Africa (IDA & IBRD countries)Middle incomeMoldovaMongoliaMontenegroMoroccoMozambiqueMyanmarNepalNetherlandsNew CaledoniaNew ZealandNicaraguaNigerNigeriaNorth AmericaNorwayOECD membersOmanOther small statesPacific island small statesPakistanPanamaPapua New GuineaParaguayPeruPhilippinesPolandPortugalPost-demographic dividendPre-demographic dividendQatarRomaniaRussian FederationRwandaSamoaSaudi ArabiaSenegalSerbiaSeychellesSierra LeoneSingaporeSlovak RepublicSloveniaSmall statesSomaliaSouth AfricaSouth AsiaSouth Asia (IDA & IBRD)SpainSri LankaSt. LuciaSt. Vincent and the GrenadinesSub-Saharan Africa Sub-Saharan Africa (excluding high income)Sub-Saharan Africa (IDA & IBRD countries)SudanSurinameSwedenSwitzerlandSyrian Arab RepublicTajikistanTanzaniaThailandTogoTrinidad and TobagoTunisiaTurkeyTurkmenistanUgandaUkraineUnited Arab EmiratesUnited KingdomUnited StatesUpper middle incomeUruguayUzbekistanVenezuela, RBVietnamWorldYemen, Rep.ZambiaZimbabwe Timeline:
This timeline shows a graph from 1961 to 2015 of Europe & Central Asia (excluding high income). No data until 1960. Number of actual observations by date: 55.
Source name:
World Development Indicators
Source organization:
World Bank staff estimates based data from International Monetary Fund's Direction of Trade database.
Categories, topics:
Private Sector, Trade
Last updated:
apr 23, 2017
Indicators value changes by year
Maximum:
22.536
jan 1, 1982
At the date of observation
Value
Absolute change
Change from previous value
jan 1, 1961
4.549
+4.549
0.0%
jan 1, 1962
5.349
+0.8
17.6%
jan 1, 1963
5.475
+0.126
2.35%
jan 1, 1964
4.541
-0.934
-17.06%
jan 1, 1965
4.241
-0.3
-6.61%
jan 1, 1966
4.605
+0.364
8.58%
jan 1, 1967
5.038
+0.433
9.41%
jan 1, 1968
6.89
+1.852
36.75%
jan 1, 1969
5.843
-1.047
-15.2%
jan 1, 1970
5.865
+0.022
0.37%
jan 1, 1971
5.212
-0.652
-11.12%
jan 1, 1972
5.263
+0.051
0.97%
jan 1, 1973
5.799
+0.536
10.19%
jan 1, 1974
6.923
+1.124
19.38%
jan 1, 1975
9.621
+2.698
38.97%
jan 1, 1976
10.204
+0.583
6.05%
jan 1, 1977
9.969
-0.234
-2.3%
jan 1, 1978
10.613
+0.644
6.46%
jan 1, 1979
10.878
+0.266
2.5%
jan 1, 1980
11.592
+0.713
6.56%
jan 1, 1981
12.478
+0.886
7.64%
jan 1, 1982
22.536
+10.058
80.61%
jan 1, 1983
21.058
-1.478
-6.56%
jan 1, 1984
17.585
-3.474
-16.5%
jan 1, 1985
18.301
+0.716
4.07%
jan 1, 1986
16.732
-1.569
-8.57%
jan 1, 1987
15.557
-1.175
-7.02%
jan 1, 1988
15.067
-0.49
-3.15%
jan 1, 1989
14.4
-0.667
-4.43%
jan 1, 1990
11.337
-3.063
-21.27%
jan 1, 1991
11.207
-0.131
-1.15%
jan 1, 1992
12.725
+1.518
13.55%
jan 1, 1993
5.235
-7.49
-58.86%
jan 1, 1994
4.764
-0.471
-9.0%
jan 1, 1995
3.656
-1.108
-23.25%
jan 1, 1996
3.682
+0.026
0.7%
jan 1, 1997
3.628
-0.054
-1.46%
jan 1, 1998
3.496
-0.132
-3.64%
jan 1, 1999
4.152
+0.656
18.77%
jan 1, 2000
4.176
+0.024
0.58%
jan 1, 2001
3.06
-1.116
-26.73%
jan 1, 2002
4.146
+1.086
35.49%
jan 1, 2003
4.286
+0.14
3.37%
jan 1, 2004
3.957
-0.329
-7.67%
jan 1, 2005
4.538
+0.581
14.68%
jan 1, 2006
4.362
-0.176
-3.88%
jan 1, 2007
3.966
-0.396
-9.08%
jan 1, 2008
4.456
+0.491
12.38%
jan 1, 2009
5.076
+0.62
13.9%
jan 1, 2010
5.984
+0.908
17.88%
jan 1, 2011
5.438
-0.546
-9.12%
jan 1, 2012
4.835
-0.603
-11.09%
jan 1, 2013
6.265
+1.43
29.59%
jan 1, 2014
5.85
-0.416
-6.63%
jan 1, 2015
6.466
+0.617
10.55%
Ranking of countries by current statistics by years


Comments: