29
/
en
AIzaSyAYiBZKx7MnpbEhh9jyipgxe19OcubqV5w
April 1, 2024
106233
China
CHN
true
2
1
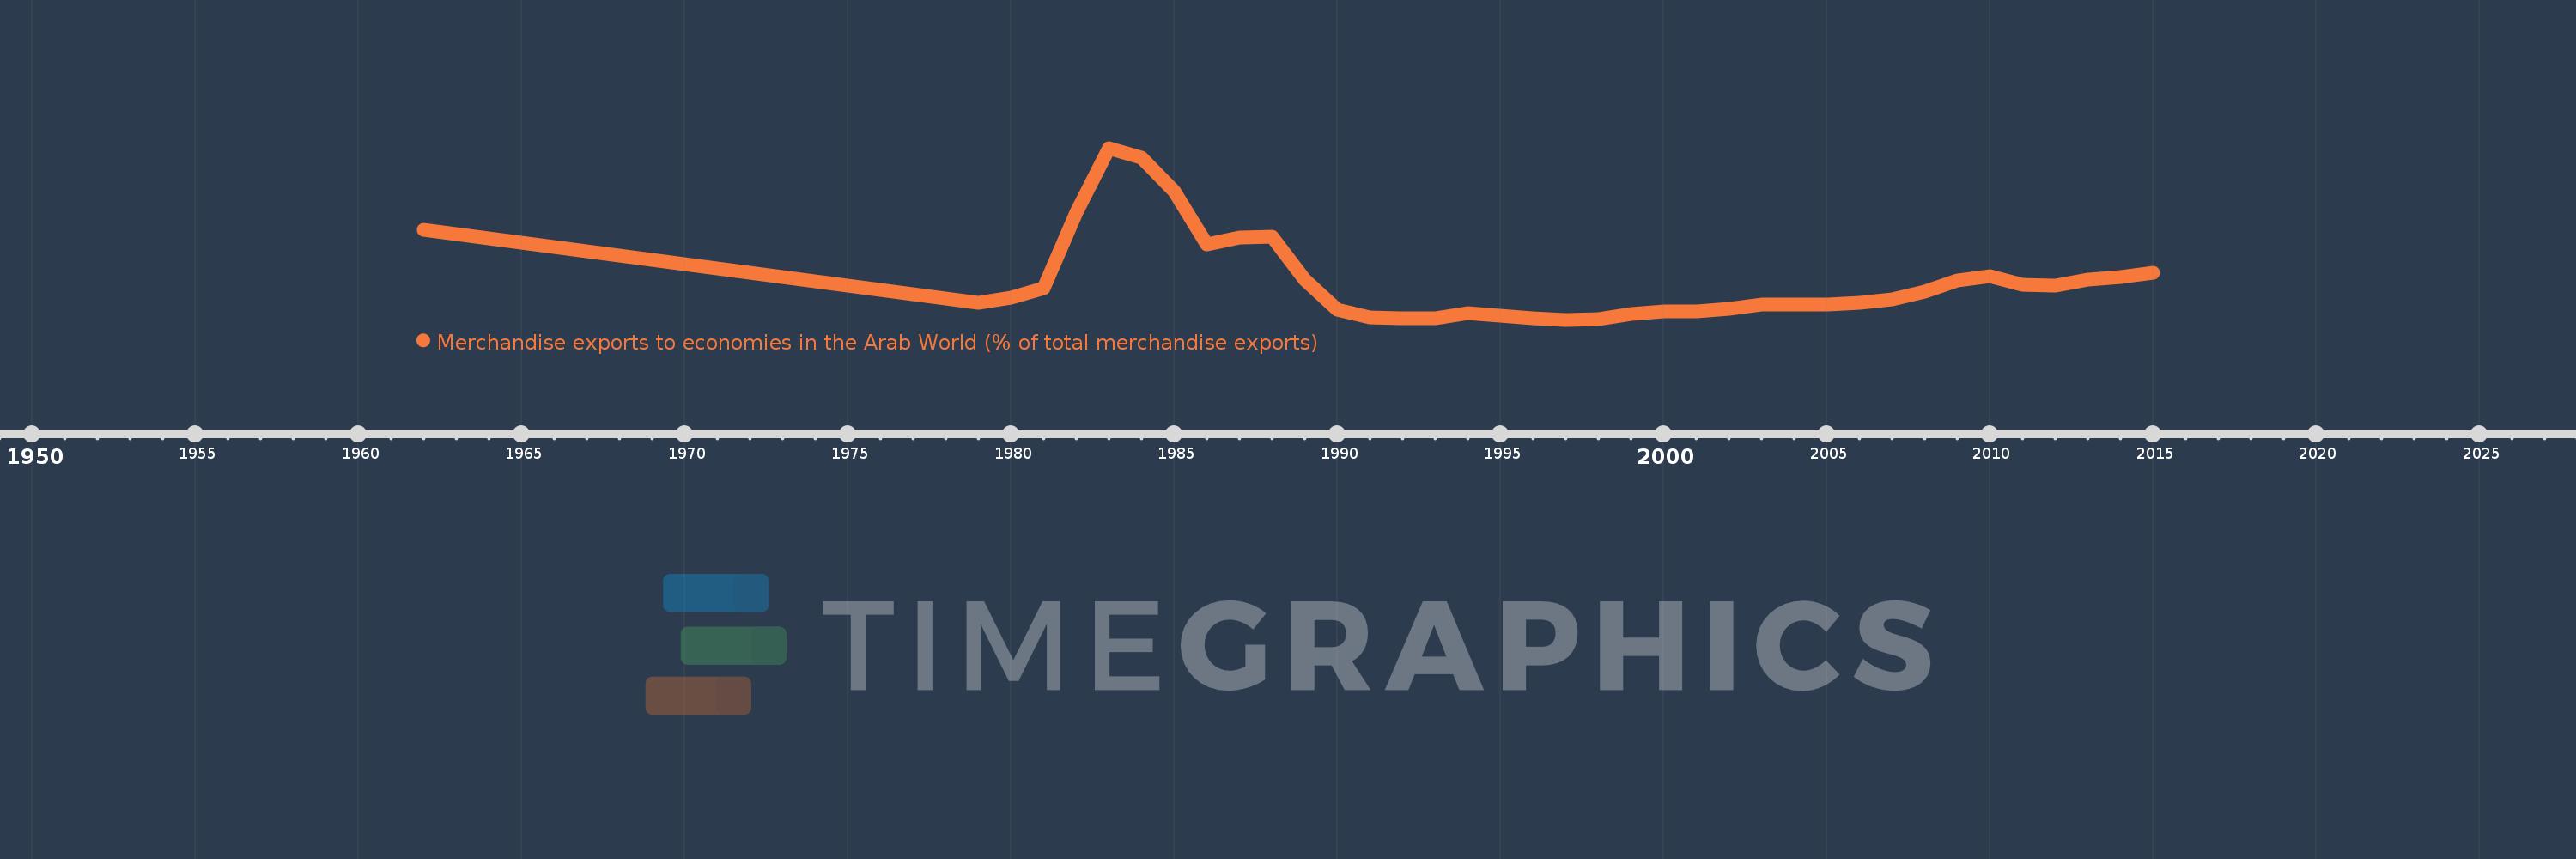
Merchandise exports to economies in the Arab World (% of total merchandise exports)
2015,2014,2013,2012,2011,2010,2009,2008,2007,2006,2005,2004,2003,2002,2001,2000,1999,1998,1997,1996,1995,1994,1993,1992,1991,1990,1989,1988,1987,1986,1985,1984,1983,1982,1981,1980,1979,1962
This statistics in other country:
AfghanistanAlbaniaAlgeriaAngolaArab WorldArgentinaArmeniaArubaAustraliaAustriaAzerbaijanBahamas, TheBahrainBangladeshBarbadosBelarusBelgiumBelizeBeninBermudaBoliviaBosnia and HerzegovinaBrazilBrunei DarussalamBulgariaBurkina FasoBurundiCabo VerdeCambodiaCameroonCanadaCaribbean small statesCentral African RepublicCentral Europe and the BalticsChadChileChinaColombiaComorosCongo, Dem. Rep.Congo, Rep.Costa RicaCote d'IvoireCroatiaCubaCyprusCzech RepublicDenmarkDjiboutiDominicaDominican RepublicEarly-demographic dividendEast Asia & PacificEast Asia & Pacific (excluding high income)East Asia & Pacific (IDA & IBRD countries)EcuadorEgypt, Arab Rep.El SalvadorEstoniaEthiopiaEuro areaEurope & Central AsiaEurope & Central Asia (excluding high income)Europe & Central Asia (IDA & IBRD countries)European UnionFijiFinlandFragile and conflict affected situationsFranceGabonGambia, TheGeorgiaGermanyGhanaGreeceGreenlandGrenadaGuatemalaGuineaGuinea-BissauGuyanaHaitiHeavily indebted poor countries (HIPC)High incomeHondurasHong Kong SAR, ChinaHungaryIBRD onlyIcelandIDA & IBRD totalIDA blendIDA onlyIDA totalIndiaIndonesiaIran, Islamic Rep.IraqIrelandIsraelItalyJamaicaJapanJordanKazakhstanKenyaKorea, Dem. People’s Rep.Korea, Rep.KosovoKuwaitKyrgyz RepublicLao PDRLate-demographic dividendLatin America & Caribbean Latin America & Caribbean (excluding high income)Latin America & the Caribbean (IDA & IBRD countries)LatviaLeast developed countries: UN classificationLebanonLiberiaLibyaLithuaniaLow & middle incomeLow incomeLower middle incomeLuxembourgMacao SAR, ChinaMacedonia, FYRMadagascarMalawiMalaysiaMaldivesMaliMaltaMauritaniaMauritiusMexicoMiddle East & North AfricaMiddle East & North Africa (excluding high income)Middle East & North Africa (IDA & IBRD countries)Middle incomeMoldovaMongoliaMontenegroMoroccoMozambiqueMyanmarNepalNetherlandsNew CaledoniaNew ZealandNicaraguaNigerNigeriaNorth AmericaNorwayOECD membersOmanOther small statesPacific island small statesPakistanPanamaPapua New GuineaParaguayPeruPhilippinesPolandPortugalPost-demographic dividendPre-demographic dividendQatarRomaniaRussian FederationRwandaSamoaSaudi ArabiaSenegalSerbiaSeychellesSierra LeoneSingaporeSlovak RepublicSloveniaSmall statesSomaliaSouth AfricaSouth AsiaSouth Asia (IDA & IBRD)SpainSri LankaSt. LuciaSt. Vincent and the GrenadinesSub-Saharan Africa Sub-Saharan Africa (excluding high income)Sub-Saharan Africa (IDA & IBRD countries)SudanSurinameSwedenSwitzerlandSyrian Arab RepublicTajikistanTanzaniaThailandTogoTrinidad and TobagoTunisiaTurkeyTurkmenistanUgandaUkraineUnited Arab EmiratesUnited KingdomUnited StatesUpper middle incomeUruguayUzbekistanVenezuela, RBVietnamWorldYemen, Rep.ZambiaZimbabwe Timeline:
This timeline shows a graph from 1962 to 2015 of China. No data until 1961. Number of actual observations by date: 38.
Source name:
World Development Indicators
Source organization:
World Bank staff estimates based data from International Monetary Fund's Direction of Trade database.
Categories, topics:
Private Sector, Trade
Last updated:
apr 23, 2017
Indicators value changes by year
At the date of observation
Value
Absolute change
Change from previous value
jan 1, 1962
7.365
+7.365
0.0%
jan 1, 1979
3.095
-4.27
-57.97%
jan 1, 1980
3.406
+0.311
10.04%
jan 1, 1981
3.958
+0.552
16.21%
jan 1, 1982
8.382
+4.424
111.77%
jan 1, 1983
12.16
+3.778
45.07%
jan 1, 1984
11.606
-0.555
-4.56%
jan 1, 1985
9.642
-1.964
-16.92%
jan 1, 1986
6.5
-3.142
-32.59%
jan 1, 1987
6.92
+0.42
6.46%
jan 1, 1988
6.961
+0.042
0.6%
jan 1, 1989
4.441
-2.52
-36.2%
jan 1, 1990
2.683
-1.758
-39.59%
jan 1, 1991
2.246
-0.437
-16.28%
jan 1, 1992
2.156
-0.09
-4.01%
jan 1, 1993
2.176
+0.02
0.91%
jan 1, 1994
2.484
+0.308
14.15%
jan 1, 1995
2.32
-0.163
-6.58%
jan 1, 1996
2.189
-0.131
-5.64%
jan 1, 1997
2.088
-0.102
-4.65%
jan 1, 1998
2.105
+0.018
0.85%
jan 1, 1999
2.421
+0.316
15.02%
jan 1, 2000
2.552
+0.13
5.38%
jan 1, 2001
2.557
+0.005
0.2%
jan 1, 2002
2.709
+0.152
5.96%
jan 1, 2003
2.956
+0.246
9.1%
jan 1, 2004
2.977
+0.021
0.72%
jan 1, 2005
2.97
-0.007
-0.22%
jan 1, 2006
3.098
+0.127
4.29%
jan 1, 2007
3.28
+0.183
5.9%
jan 1, 2008
3.743
+0.462
14.1%
jan 1, 2009
4.38
+0.637
17.03%
jan 1, 2010
4.657
+0.277
6.32%
jan 1, 2011
4.113
-0.544
-11.69%
jan 1, 2012
4.101
-0.012
-0.29%
jan 1, 2013
4.453
+0.352
8.6%
jan 1, 2014
4.581
+0.128
2.87%
jan 1, 2015
4.859
+0.278
6.07%
Ranking of countries by current statistics by years


Comments: