29
/
en
AIzaSyAYiBZKx7MnpbEhh9jyipgxe19OcubqV5w
April 1, 2024
231315
Rwanda
RWA
true
2
1
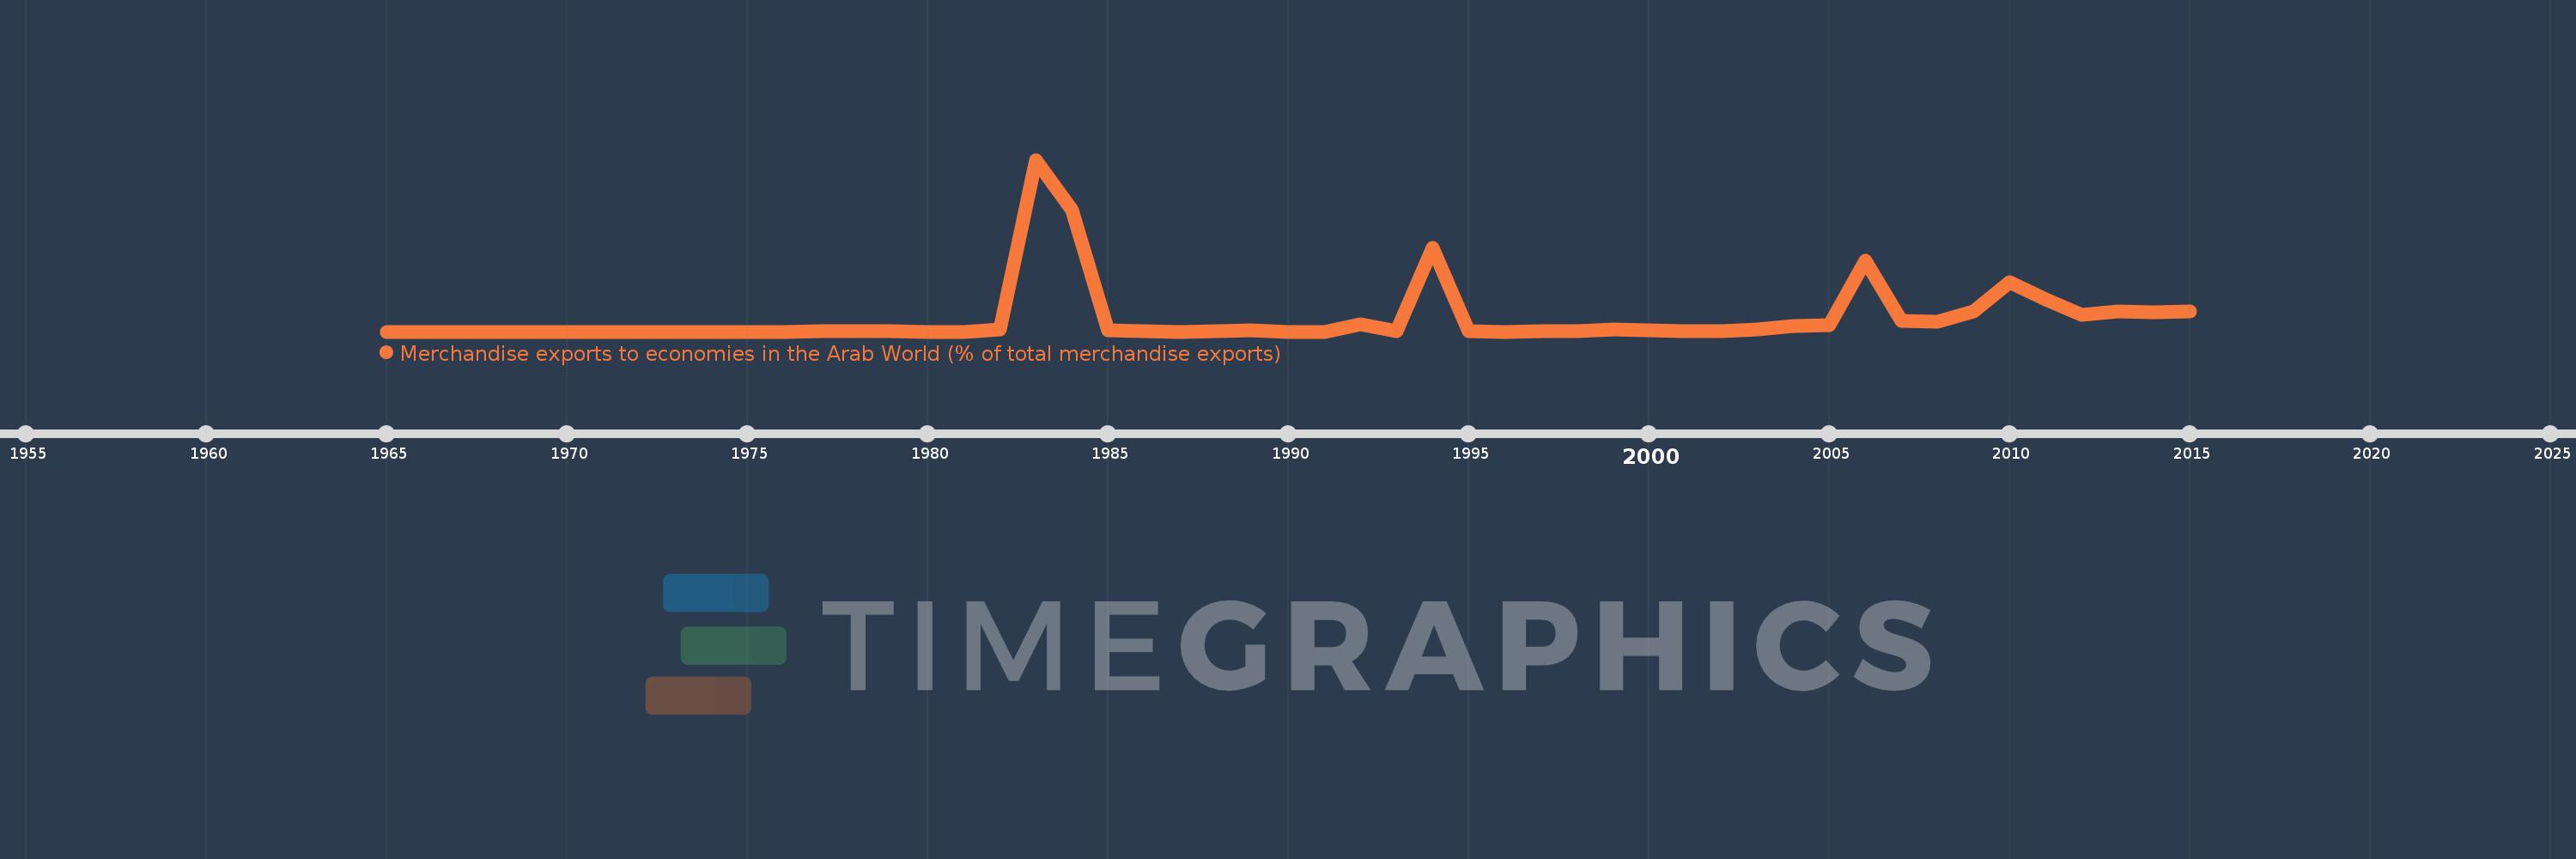
Merchandise exports to economies in the Arab World (% of total merchandise exports)
2015,2014,2013,2012,2011,2010,2009,2008,2007,2006,2005,2004,2003,2002,2001,2000,1999,1998,1997,1996,1995,1994,1993,1992,1991,1990,1989,1988,1987,1986,1985,1984,1983,1982,1981,1980,1979,1978,1977,1976,1975,1974,1973,1972,1971,1970,1969,1968,1967,1966,1965
This statistics in other country:
AfghanistanAlbaniaAlgeriaAngolaArab WorldArgentinaArmeniaArubaAustraliaAustriaAzerbaijanBahamas, TheBahrainBangladeshBarbadosBelarusBelgiumBelizeBeninBermudaBoliviaBosnia and HerzegovinaBrazilBrunei DarussalamBulgariaBurkina FasoBurundiCabo VerdeCambodiaCameroonCanadaCaribbean small statesCentral African RepublicCentral Europe and the BalticsChadChileChinaColombiaComorosCongo, Dem. Rep.Congo, Rep.Costa RicaCote d'IvoireCroatiaCubaCyprusCzech RepublicDenmarkDjiboutiDominicaDominican RepublicEarly-demographic dividendEast Asia & PacificEast Asia & Pacific (excluding high income)East Asia & Pacific (IDA & IBRD countries)EcuadorEgypt, Arab Rep.El SalvadorEstoniaEthiopiaEuro areaEurope & Central AsiaEurope & Central Asia (excluding high income)Europe & Central Asia (IDA & IBRD countries)European UnionFijiFinlandFragile and conflict affected situationsFranceGabonGambia, TheGeorgiaGermanyGhanaGreeceGreenlandGrenadaGuatemalaGuineaGuinea-BissauGuyanaHaitiHeavily indebted poor countries (HIPC)High incomeHondurasHong Kong SAR, ChinaHungaryIBRD onlyIcelandIDA & IBRD totalIDA blendIDA onlyIDA totalIndiaIndonesiaIran, Islamic Rep.IraqIrelandIsraelItalyJamaicaJapanJordanKazakhstanKenyaKorea, Dem. People’s Rep.Korea, Rep.KosovoKuwaitKyrgyz RepublicLao PDRLate-demographic dividendLatin America & Caribbean Latin America & Caribbean (excluding high income)Latin America & the Caribbean (IDA & IBRD countries)LatviaLeast developed countries: UN classificationLebanonLiberiaLibyaLithuaniaLow & middle incomeLow incomeLower middle incomeLuxembourgMacao SAR, ChinaMacedonia, FYRMadagascarMalawiMalaysiaMaldivesMaliMaltaMauritaniaMauritiusMexicoMiddle East & North AfricaMiddle East & North Africa (excluding high income)Middle East & North Africa (IDA & IBRD countries)Middle incomeMoldovaMongoliaMontenegroMoroccoMozambiqueMyanmarNepalNetherlandsNew CaledoniaNew ZealandNicaraguaNigerNigeriaNorth AmericaNorwayOECD membersOmanOther small statesPacific island small statesPakistanPanamaPapua New GuineaParaguayPeruPhilippinesPolandPortugalPost-demographic dividendPre-demographic dividendQatarRomaniaRussian FederationRwandaSamoaSaudi ArabiaSenegalSerbiaSeychellesSierra LeoneSingaporeSlovak RepublicSloveniaSmall statesSomaliaSouth AfricaSouth AsiaSouth Asia (IDA & IBRD)SpainSri LankaSt. LuciaSt. Vincent and the GrenadinesSub-Saharan Africa Sub-Saharan Africa (excluding high income)Sub-Saharan Africa (IDA & IBRD countries)SudanSurinameSwedenSwitzerlandSyrian Arab RepublicTajikistanTanzaniaThailandTogoTrinidad and TobagoTunisiaTurkeyTurkmenistanUgandaUkraineUnited Arab EmiratesUnited KingdomUnited StatesUpper middle incomeUruguayUzbekistanVenezuela, RBVietnamWorldYemen, Rep.ZambiaZimbabwe Timeline:
This timeline shows a graph from 1965 to 2015 of Rwanda. No data until 1964. Number of actual observations by date: 51.
Source name:
World Development Indicators
Source organization:
World Bank staff estimates based data from International Monetary Fund's Direction of Trade database.
Categories, topics:
Private Sector, Trade
Last updated:
apr 23, 2017
Indicators value changes by year
At the date of observation
Value
Absolute change
Change from previous value
jan 1, 1977
0.015
+0.015
%
jan 1, 1978
0.008
-0.007
-48.65%
jan 1, 1979
0.004
-0.003
-42.76%
jan 1, 1980
0.0
-0.004
-100.0%
jan 1, 1982
0.095
+0.095
%
jan 1, 1983
8.345
+8.251
8.73K%
jan 1, 1984
5.909
-2.437
-29.2%
jan 1, 1985
0.052
-5.857
-99.12%
jan 1, 1986
0.005
-0.047
-91.07%
jan 1, 1987
0.0
-0.005
-100.0%
jan 1, 1989
0.043
+0.013
42.57%
jan 1, 1990
0.0
-0.043
-100.0%
jan 1, 1992
0.371
+0.371
%
jan 1, 1993
0.037
-0.334
-90.03%
jan 1, 1994
4.055
+4.018
10.87K%
jan 1, 1995
0.002
-4.053
-99.96%
jan 1, 1996
0.0
-0.001
-80.81%
jan 1, 1997
0.016
+0.016
5.34K%
jan 1, 1998
0.004
-0.013
-77.7%
jan 1, 1999
0.092
+0.089
2.43K%
jan 1, 2000
0.049
-0.043
-46.96%
jan 1, 2001
0.015
-0.034
-69.68%
jan 1, 2002
0.01
-0.005
-34.2%
jan 1, 2003
0.088
+0.078
803.41%
jan 1, 2004
0.278
+0.19
215.93%
jan 1, 2005
0.294
+0.015
5.5%
jan 1, 2006
3.436
+3.142
1.07K%
jan 1, 2007
0.506
-2.93
-85.28%
jan 1, 2008
0.461
-0.045
-8.86%
jan 1, 2009
0.975
+0.514
111.42%
jan 1, 2010
2.388
+1.413
144.99%
jan 1, 2011
1.584
-0.804
-33.68%
jan 1, 2012
0.814
-0.77
-48.62%
jan 1, 2013
0.996
+0.182
22.4%
jan 1, 2014
0.925
-0.071
-7.13%
jan 1, 2015
0.973
+0.048
5.2%
Ranking of countries by current statistics by years


Comments: