29
/
en
AIzaSyAYiBZKx7MnpbEhh9jyipgxe19OcubqV5w
April 1, 2024
145927
Guinea
GIN
true
2
1
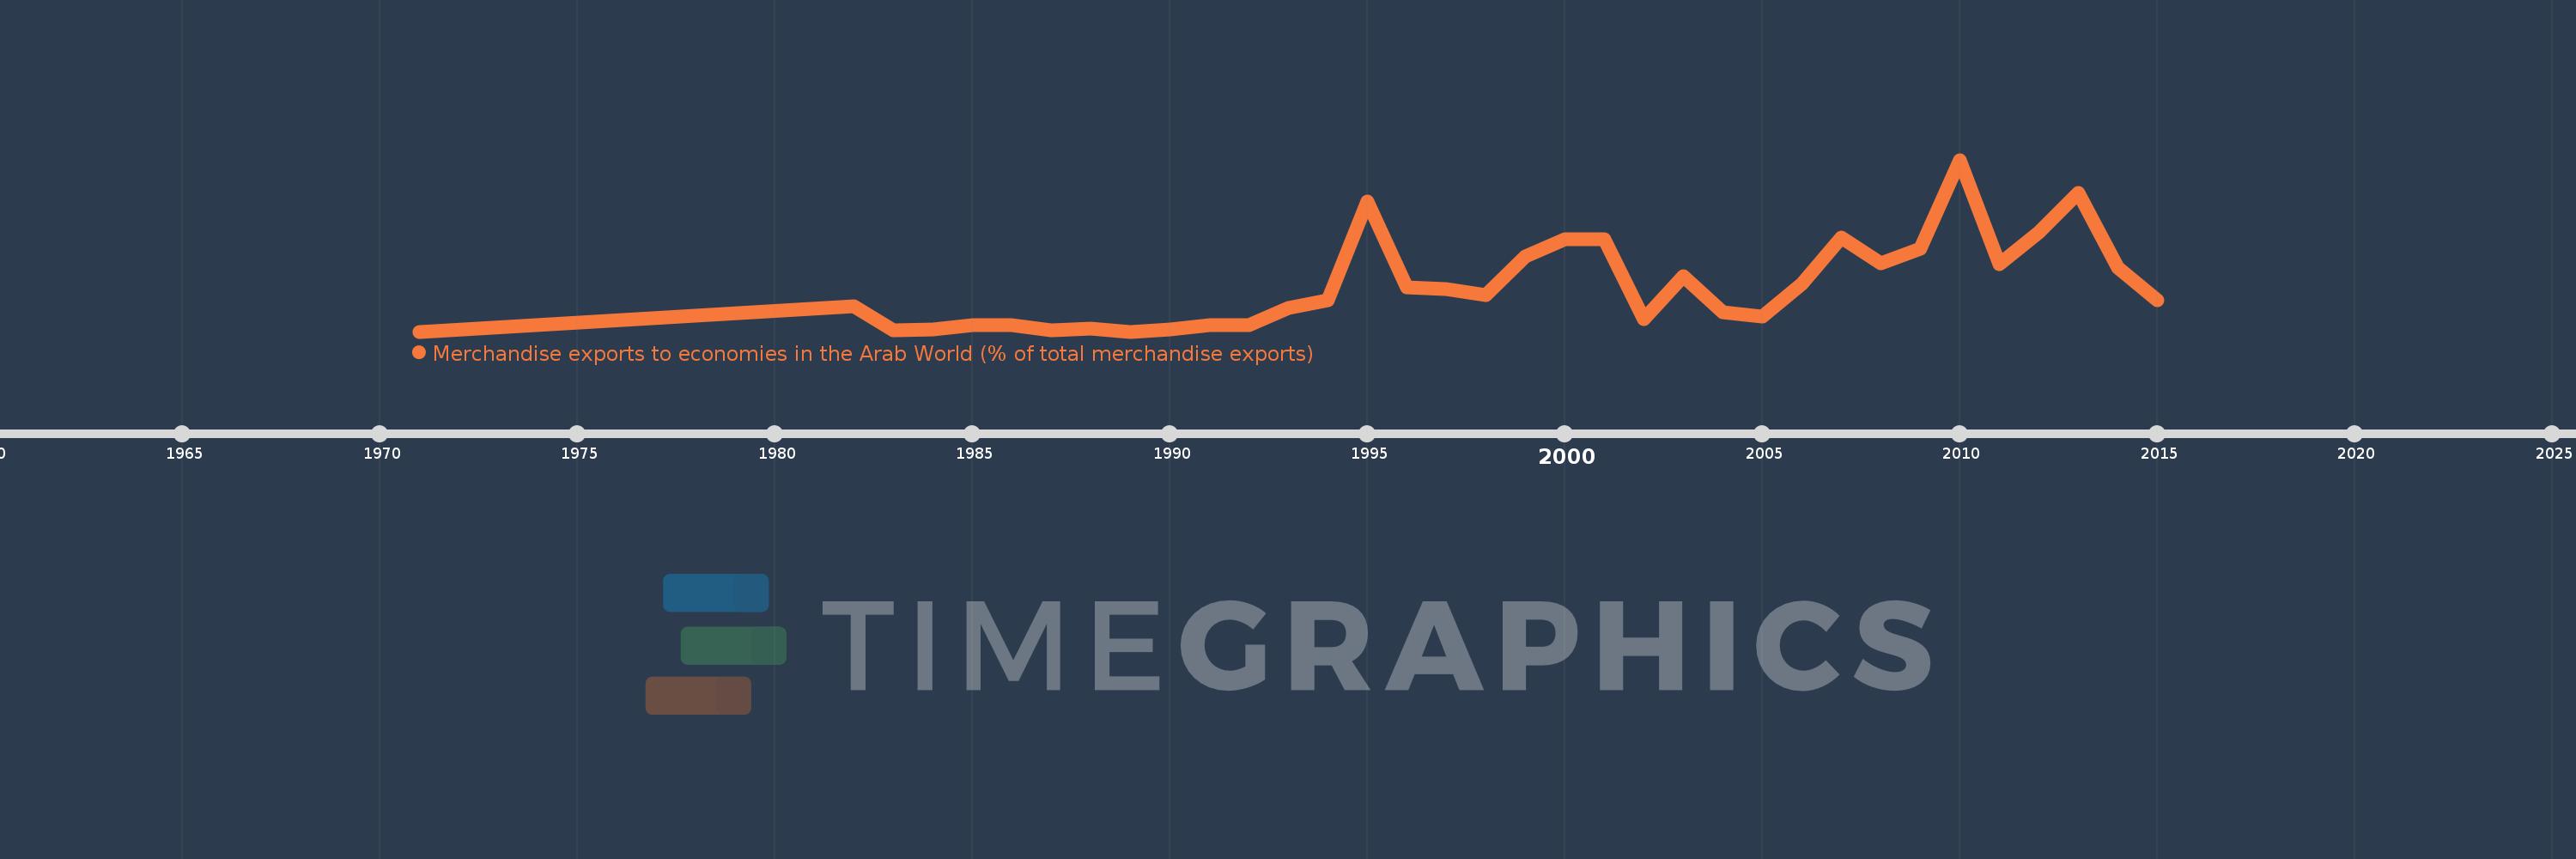
Merchandise exports to economies in the Arab World (% of total merchandise exports)
2015,2014,2013,2012,2011,2010,2009,2008,2007,2006,2005,2004,2003,2002,2001,2000,1999,1998,1997,1996,1995,1994,1993,1992,1991,1990,1989,1988,1987,1986,1985,1984,1983,1982,1971
This statistics in other country:
AfghanistanAlbaniaAlgeriaAngolaArab WorldArgentinaArmeniaArubaAustraliaAustriaAzerbaijanBahamas, TheBahrainBangladeshBarbadosBelarusBelgiumBelizeBeninBermudaBoliviaBosnia and HerzegovinaBrazilBrunei DarussalamBulgariaBurkina FasoBurundiCabo VerdeCambodiaCameroonCanadaCaribbean small statesCentral African RepublicCentral Europe and the BalticsChadChileChinaColombiaComorosCongo, Dem. Rep.Congo, Rep.Costa RicaCote d'IvoireCroatiaCubaCyprusCzech RepublicDenmarkDjiboutiDominicaDominican RepublicEarly-demographic dividendEast Asia & PacificEast Asia & Pacific (excluding high income)East Asia & Pacific (IDA & IBRD countries)EcuadorEgypt, Arab Rep.El SalvadorEstoniaEthiopiaEuro areaEurope & Central AsiaEurope & Central Asia (excluding high income)Europe & Central Asia (IDA & IBRD countries)European UnionFijiFinlandFragile and conflict affected situationsFranceGabonGambia, TheGeorgiaGermanyGhanaGreeceGreenlandGrenadaGuatemalaGuineaGuinea-BissauGuyanaHaitiHeavily indebted poor countries (HIPC)High incomeHondurasHong Kong SAR, ChinaHungaryIBRD onlyIcelandIDA & IBRD totalIDA blendIDA onlyIDA totalIndiaIndonesiaIran, Islamic Rep.IraqIrelandIsraelItalyJamaicaJapanJordanKazakhstanKenyaKorea, Dem. People’s Rep.Korea, Rep.KosovoKuwaitKyrgyz RepublicLao PDRLate-demographic dividendLatin America & Caribbean Latin America & Caribbean (excluding high income)Latin America & the Caribbean (IDA & IBRD countries)LatviaLeast developed countries: UN classificationLebanonLiberiaLibyaLithuaniaLow & middle incomeLow incomeLower middle incomeLuxembourgMacao SAR, ChinaMacedonia, FYRMadagascarMalawiMalaysiaMaldivesMaliMaltaMauritaniaMauritiusMexicoMiddle East & North AfricaMiddle East & North Africa (excluding high income)Middle East & North Africa (IDA & IBRD countries)Middle incomeMoldovaMongoliaMontenegroMoroccoMozambiqueMyanmarNepalNetherlandsNew CaledoniaNew ZealandNicaraguaNigerNigeriaNorth AmericaNorwayOECD membersOmanOther small statesPacific island small statesPakistanPanamaPapua New GuineaParaguayPeruPhilippinesPolandPortugalPost-demographic dividendPre-demographic dividendQatarRomaniaRussian FederationRwandaSamoaSaudi ArabiaSenegalSerbiaSeychellesSierra LeoneSingaporeSlovak RepublicSloveniaSmall statesSomaliaSouth AfricaSouth AsiaSouth Asia (IDA & IBRD)SpainSri LankaSt. LuciaSt. Vincent and the GrenadinesSub-Saharan Africa Sub-Saharan Africa (excluding high income)Sub-Saharan Africa (IDA & IBRD countries)SudanSurinameSwedenSwitzerlandSyrian Arab RepublicTajikistanTanzaniaThailandTogoTrinidad and TobagoTunisiaTurkeyTurkmenistanUgandaUkraineUnited Arab EmiratesUnited KingdomUnited StatesUpper middle incomeUruguayUzbekistanVenezuela, RBVietnamWorldYemen, Rep.ZambiaZimbabwe Timeline:
This timeline shows a graph from 1971 to 2015 of Guinea. No data until 1970. Number of actual observations by date: 35.
Source name:
World Development Indicators
Source organization:
World Bank staff estimates based data from International Monetary Fund's Direction of Trade database.
Categories, topics:
Private Sector, Trade
Last updated:
apr 23, 2017
Indicators value changes by year
At the date of observation
Value
Absolute change
Change from previous value
jan 1, 1982
0.311
+0.311
%
jan 1, 1983
0.014
-0.297
-95.52%
jan 1, 1984
0.023
+0.009
61.83%
jan 1, 1985
0.079
+0.057
251.07%
jan 1, 1986
0.075
-0.004
-5.55%
jan 1, 1987
0.021
-0.054
-71.8%
jan 1, 1988
0.038
+0.017
81.19%
jan 1, 1989
0.0
-0.038
-98.81%
jan 1, 1990
0.026
+0.026
5.72K%
jan 1, 1991
0.079
+0.053
199.31%
jan 1, 1992
0.08
+0.001
1.1%
jan 1, 1993
0.297
+0.217
270.45%
jan 1, 1994
0.394
+0.097
32.63%
jan 1, 1995
1.627
+1.233
312.87%
jan 1, 1996
0.548
-1.079
-66.33%
jan 1, 1997
0.534
-0.013
-2.44%
jan 1, 1998
0.457
-0.077
-14.5%
jan 1, 1999
0.937
+0.48
105.16%
jan 1, 2000
1.148
+0.211
22.47%
jan 1, 2001
1.155
+0.007
0.62%
jan 1, 2002
0.159
-0.996
-86.22%
jan 1, 2003
0.695
+0.536
336.67%
jan 1, 2004
0.236
-0.459
-66.08%
jan 1, 2005
0.187
-0.048
-20.45%
jan 1, 2006
0.595
+0.408
217.42%
jan 1, 2007
1.178
+0.583
97.91%
jan 1, 2008
0.855
-0.323
-27.4%
jan 1, 2009
1.031
+0.176
20.62%
jan 1, 2010
2.142
+1.111
107.73%
jan 1, 2011
0.845
-1.298
-60.57%
jan 1, 2012
1.239
+0.394
46.65%
jan 1, 2013
1.735
+0.496
40.03%
jan 1, 2014
0.8
-0.935
-53.88%
jan 1, 2015
0.393
-0.407
-50.88%
Ranking of countries by current statistics by years


Comments: