29
/
en
AIzaSyAYiBZKx7MnpbEhh9jyipgxe19OcubqV5w
April 1, 2024
276888
United States
USA
true
2
1
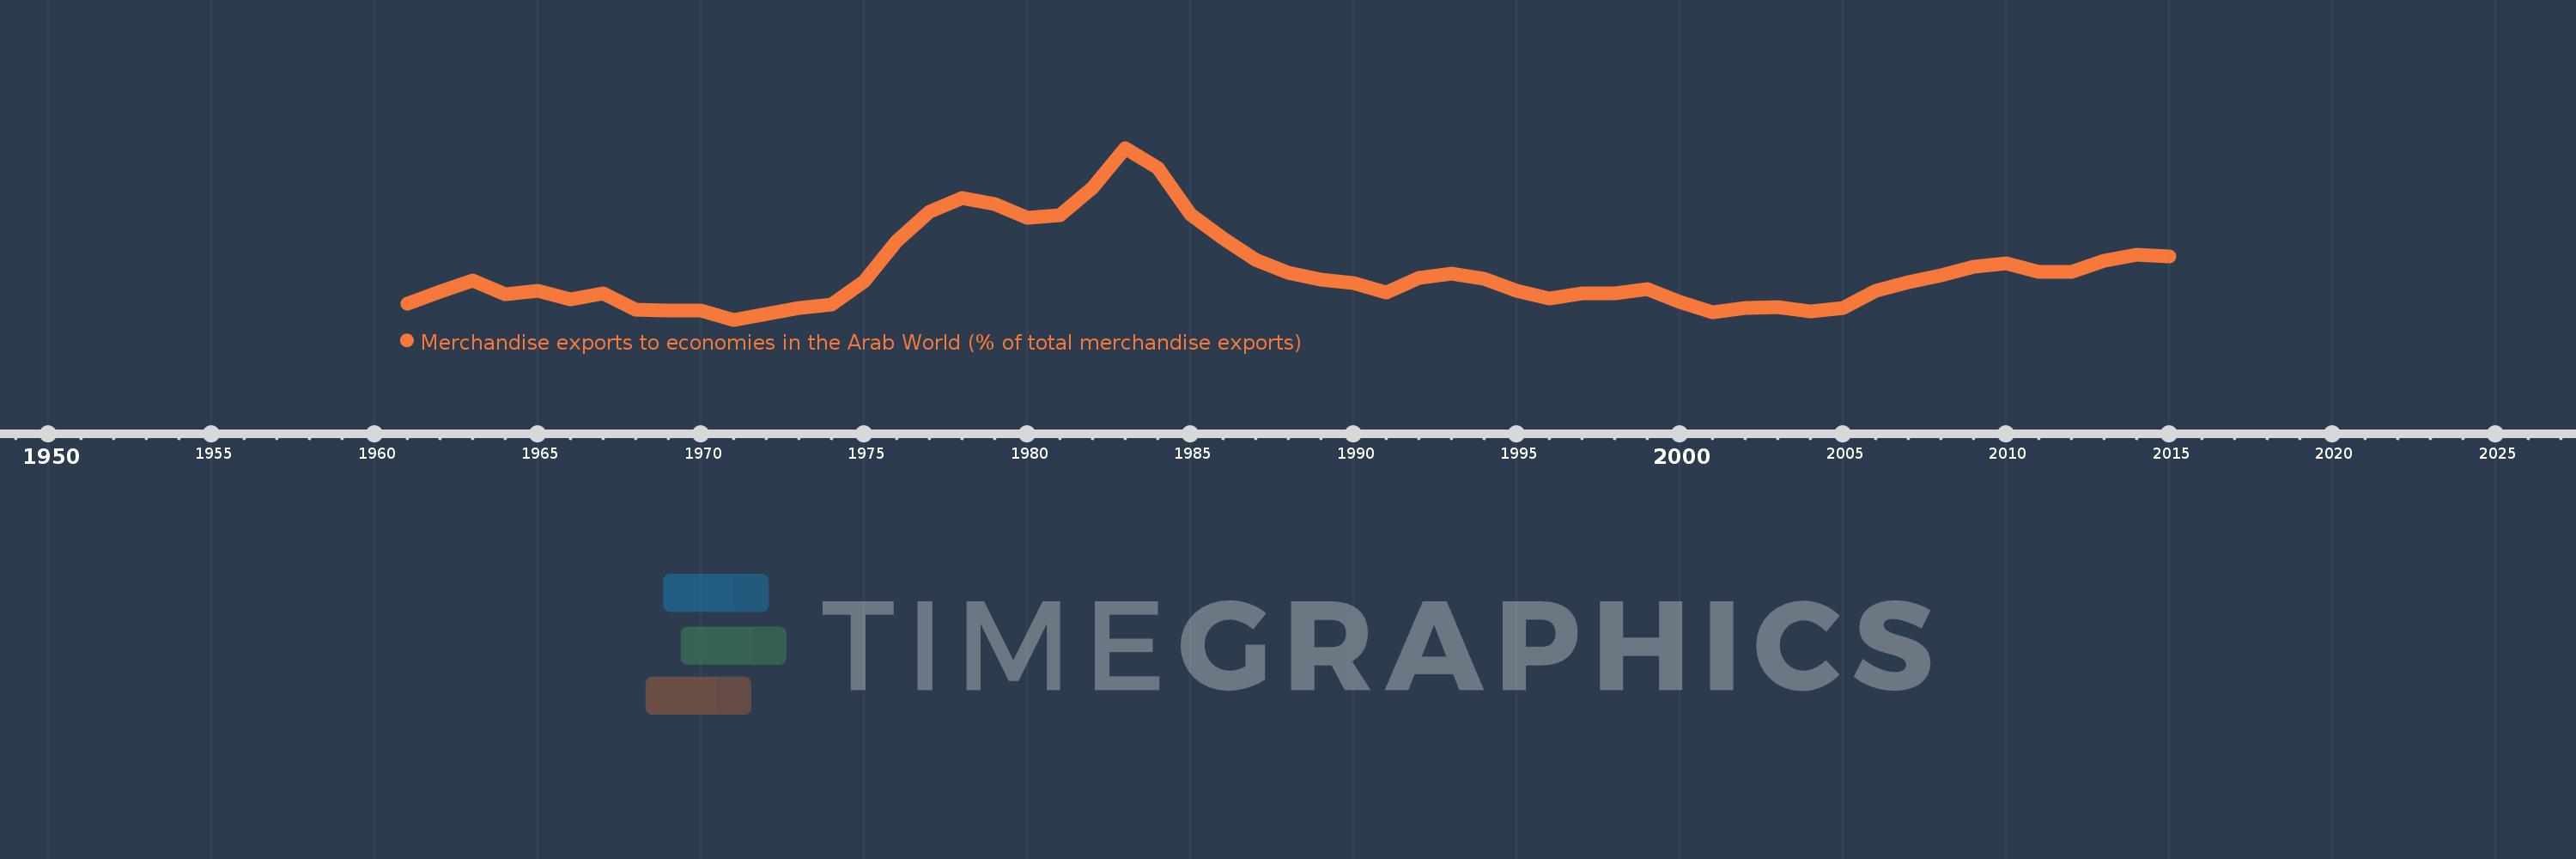
Merchandise exports to economies in the Arab World (% of total merchandise exports)
2015,2014,2013,2012,2011,2010,2009,2008,2007,2006,2005,2004,2003,2002,2001,2000,1999,1998,1997,1996,1995,1994,1993,1992,1991,1990,1989,1988,1987,1986,1985,1984,1983,1982,1981,1980,1979,1978,1977,1976,1975,1974,1973,1972,1971,1970,1969,1968,1967,1966,1965,1964,1963,1962,1961
This statistics in other country:
AfghanistanAlbaniaAlgeriaAngolaArab WorldArgentinaArmeniaArubaAustraliaAustriaAzerbaijanBahamas, TheBahrainBangladeshBarbadosBelarusBelgiumBelizeBeninBermudaBoliviaBosnia and HerzegovinaBrazilBrunei DarussalamBulgariaBurkina FasoBurundiCabo VerdeCambodiaCameroonCanadaCaribbean small statesCentral African RepublicCentral Europe and the BalticsChadChileChinaColombiaComorosCongo, Dem. Rep.Congo, Rep.Costa RicaCote d'IvoireCroatiaCubaCyprusCzech RepublicDenmarkDjiboutiDominicaDominican RepublicEarly-demographic dividendEast Asia & PacificEast Asia & Pacific (excluding high income)East Asia & Pacific (IDA & IBRD countries)EcuadorEgypt, Arab Rep.El SalvadorEstoniaEthiopiaEuro areaEurope & Central AsiaEurope & Central Asia (excluding high income)Europe & Central Asia (IDA & IBRD countries)European UnionFijiFinlandFragile and conflict affected situationsFranceGabonGambia, TheGeorgiaGermanyGhanaGreeceGreenlandGrenadaGuatemalaGuineaGuinea-BissauGuyanaHaitiHeavily indebted poor countries (HIPC)High incomeHondurasHong Kong SAR, ChinaHungaryIBRD onlyIcelandIDA & IBRD totalIDA blendIDA onlyIDA totalIndiaIndonesiaIran, Islamic Rep.IraqIrelandIsraelItalyJamaicaJapanJordanKazakhstanKenyaKorea, Dem. People’s Rep.Korea, Rep.KosovoKuwaitKyrgyz RepublicLao PDRLate-demographic dividendLatin America & Caribbean Latin America & Caribbean (excluding high income)Latin America & the Caribbean (IDA & IBRD countries)LatviaLeast developed countries: UN classificationLebanonLiberiaLibyaLithuaniaLow & middle incomeLow incomeLower middle incomeLuxembourgMacao SAR, ChinaMacedonia, FYRMadagascarMalawiMalaysiaMaldivesMaliMaltaMauritaniaMauritiusMexicoMiddle East & North AfricaMiddle East & North Africa (excluding high income)Middle East & North Africa (IDA & IBRD countries)Middle incomeMoldovaMongoliaMontenegroMoroccoMozambiqueMyanmarNepalNetherlandsNew CaledoniaNew ZealandNicaraguaNigerNigeriaNorth AmericaNorwayOECD membersOmanOther small statesPacific island small statesPakistanPanamaPapua New GuineaParaguayPeruPhilippinesPolandPortugalPost-demographic dividendPre-demographic dividendQatarRomaniaRussian FederationRwandaSamoaSaudi ArabiaSenegalSerbiaSeychellesSierra LeoneSingaporeSlovak RepublicSloveniaSmall statesSomaliaSouth AfricaSouth AsiaSouth Asia (IDA & IBRD)SpainSri LankaSt. LuciaSt. Vincent and the GrenadinesSub-Saharan Africa Sub-Saharan Africa (excluding high income)Sub-Saharan Africa (IDA & IBRD countries)SudanSurinameSwedenSwitzerlandSyrian Arab RepublicTajikistanTanzaniaThailandTogoTrinidad and TobagoTunisiaTurkeyTurkmenistanUgandaUkraineUnited Arab EmiratesUnited KingdomUnited StatesUpper middle incomeUruguayUzbekistanVenezuela, RBVietnamWorldYemen, Rep.ZambiaZimbabwe Timeline:
This timeline shows a graph from 1961 to 2015 of United States. No data until 1960. Number of actual observations by date: 55.
Source name:
World Development Indicators
Source organization:
World Bank staff estimates based data from International Monetary Fund's Direction of Trade database.
Categories, topics:
Private Sector, Trade
Last updated:
apr 23, 2017
Indicators value changes by year
At the date of observation
Value
Absolute change
Change from previous value
jan 1, 1961
2.552
+2.552
0.0%
jan 1, 1962
3.02
+0.468
18.36%
jan 1, 1963
3.474
+0.454
15.04%
jan 1, 1964
2.93
-0.544
-15.66%
jan 1, 1965
3.047
+0.117
3.99%
jan 1, 1966
2.718
-0.329
-10.81%
jan 1, 1967
2.94
+0.223
8.19%
jan 1, 1968
2.31
-0.631
-21.45%
jan 1, 1969
2.274
-0.036
-1.55%
jan 1, 1970
2.255
-0.019
-0.84%
jan 1, 1971
1.906
-0.348
-15.45%
jan 1, 1972
2.147
+0.241
12.64%
jan 1, 1973
2.375
+0.227
10.59%
jan 1, 1974
2.499
+0.124
5.23%
jan 1, 1975
3.449
+0.95
38.03%
jan 1, 1976
5.027
+1.578
45.74%
jan 1, 1977
6.185
+1.158
23.04%
jan 1, 1978
6.757
+0.571
9.24%
jan 1, 1979
6.506
-0.251
-3.72%
jan 1, 1980
5.948
-0.558
-8.58%
jan 1, 1981
6.075
+0.127
2.13%
jan 1, 1982
7.155
+1.08
17.78%
jan 1, 1983
8.735
+1.58
22.08%
jan 1, 1984
7.954
-0.78
-8.93%
jan 1, 1985
6.088
-1.866
-23.46%
jan 1, 1986
5.127
-0.961
-15.79%
jan 1, 1987
4.295
-0.832
-16.23%
jan 1, 1988
3.769
-0.525
-12.23%
jan 1, 1989
3.517
-0.253
-6.7%
jan 1, 1990
3.356
-0.161
-4.57%
jan 1, 1991
2.973
-0.384
-11.43%
jan 1, 1992
3.566
+0.593
19.96%
jan 1, 1993
3.725
+0.159
4.45%
jan 1, 1994
3.522
-0.202
-5.43%
jan 1, 1995
3.041
-0.482
-13.67%
jan 1, 1996
2.763
-0.278
-9.13%
jan 1, 1997
2.96
+0.197
7.14%
jan 1, 1998
2.94
-0.02
-0.69%
jan 1, 1999
3.108
+0.168
5.72%
jan 1, 2000
2.621
-0.487
-15.68%
jan 1, 2001
2.211
-0.409
-15.61%
jan 1, 2002
2.364
+0.152
6.89%
jan 1, 2003
2.395
+0.031
1.31%
jan 1, 2004
2.248
-0.146
-6.11%
jan 1, 2005
2.367
+0.118
5.26%
jan 1, 2006
3.043
+0.676
28.57%
jan 1, 2007
3.396
+0.353
11.59%
jan 1, 2008
3.672
+0.276
8.14%
jan 1, 2009
4.006
+0.334
9.09%
jan 1, 2010
4.155
+0.149
3.72%
jan 1, 2011
3.807
-0.348
-8.36%
jan 1, 2012
3.8
-0.007
-0.18%
jan 1, 2013
4.252
+0.452
11.9%
jan 1, 2014
4.498
+0.246
5.78%
jan 1, 2015
4.406
-0.092
-2.04%
Ranking of countries by current statistics by years


Comments: