29
/
en
AIzaSyAYiBZKx7MnpbEhh9jyipgxe19OcubqV5w
April 1, 2024
24282
Arab World
ARB
false
2
1
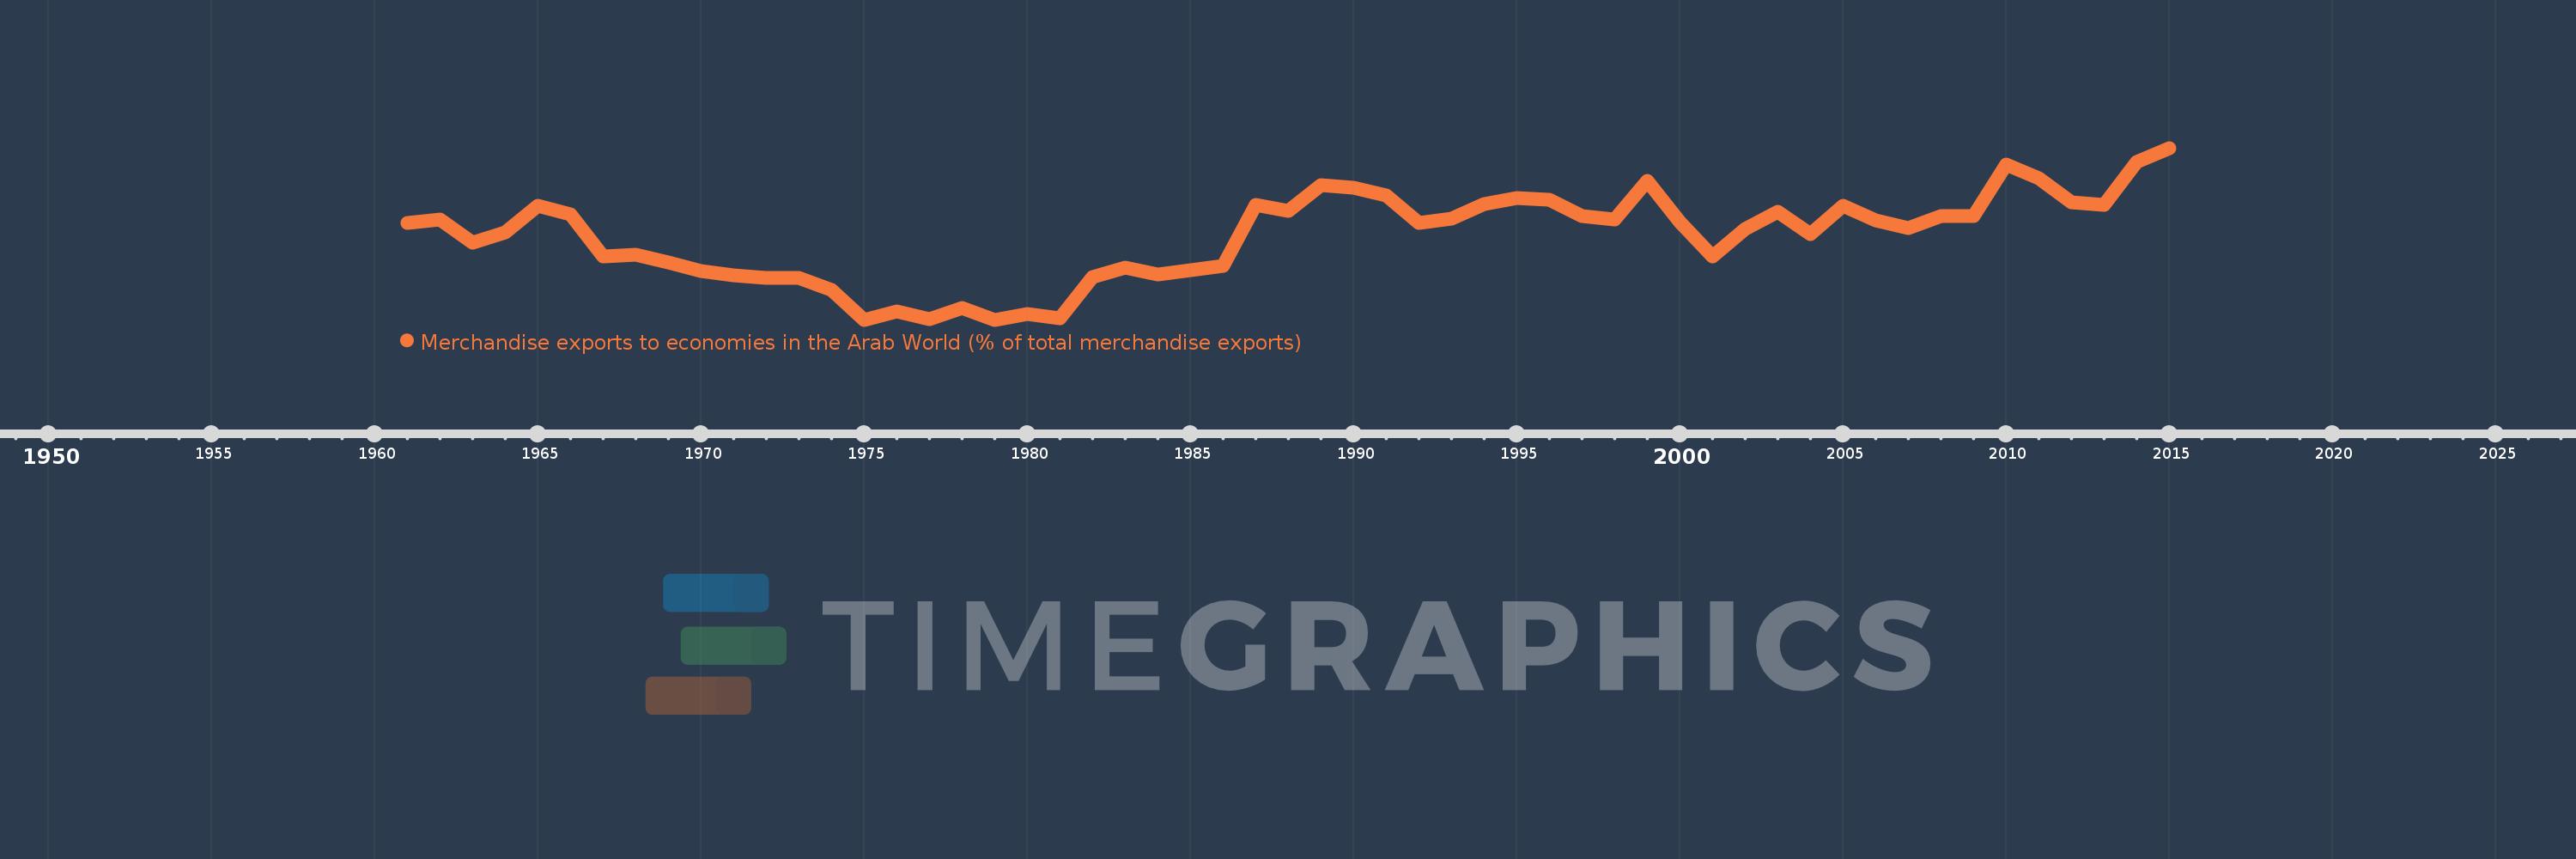
Merchandise exports to economies in the Arab World (% of total merchandise exports)
2015,2014,2013,2012,2011,2010,2009,2008,2007,2006,2005,2004,2003,2002,2001,2000,1999,1998,1997,1996,1995,1994,1993,1992,1991,1990,1989,1988,1987,1986,1985,1984,1983,1982,1981,1980,1979,1978,1977,1976,1975,1974,1973,1972,1971,1970,1969,1968,1967,1966,1965,1964,1963,1962,1961
This statistics in other country:
AfghanistanAlbaniaAlgeriaAngolaArab WorldArgentinaArmeniaArubaAustraliaAustriaAzerbaijanBahamas, TheBahrainBangladeshBarbadosBelarusBelgiumBelizeBeninBermudaBoliviaBosnia and HerzegovinaBrazilBrunei DarussalamBulgariaBurkina FasoBurundiCabo VerdeCambodiaCameroonCanadaCaribbean small statesCentral African RepublicCentral Europe and the BalticsChadChileChinaColombiaComorosCongo, Dem. Rep.Congo, Rep.Costa RicaCote d'IvoireCroatiaCubaCyprusCzech RepublicDenmarkDjiboutiDominicaDominican RepublicEarly-demographic dividendEast Asia & PacificEast Asia & Pacific (excluding high income)East Asia & Pacific (IDA & IBRD countries)EcuadorEgypt, Arab Rep.El SalvadorEstoniaEthiopiaEuro areaEurope & Central AsiaEurope & Central Asia (excluding high income)Europe & Central Asia (IDA & IBRD countries)European UnionFijiFinlandFragile and conflict affected situationsFranceGabonGambia, TheGeorgiaGermanyGhanaGreeceGreenlandGrenadaGuatemalaGuineaGuinea-BissauGuyanaHaitiHeavily indebted poor countries (HIPC)High incomeHondurasHong Kong SAR, ChinaHungaryIBRD onlyIcelandIDA & IBRD totalIDA blendIDA onlyIDA totalIndiaIndonesiaIran, Islamic Rep.IraqIrelandIsraelItalyJamaicaJapanJordanKazakhstanKenyaKorea, Dem. People’s Rep.Korea, Rep.KosovoKuwaitKyrgyz RepublicLao PDRLate-demographic dividendLatin America & Caribbean Latin America & Caribbean (excluding high income)Latin America & the Caribbean (IDA & IBRD countries)LatviaLeast developed countries: UN classificationLebanonLiberiaLibyaLithuaniaLow & middle incomeLow incomeLower middle incomeLuxembourgMacao SAR, ChinaMacedonia, FYRMadagascarMalawiMalaysiaMaldivesMaliMaltaMauritaniaMauritiusMexicoMiddle East & North AfricaMiddle East & North Africa (excluding high income)Middle East & North Africa (IDA & IBRD countries)Middle incomeMoldovaMongoliaMontenegroMoroccoMozambiqueMyanmarNepalNetherlandsNew CaledoniaNew ZealandNicaraguaNigerNigeriaNorth AmericaNorwayOECD membersOmanOther small statesPacific island small statesPakistanPanamaPapua New GuineaParaguayPeruPhilippinesPolandPortugalPost-demographic dividendPre-demographic dividendQatarRomaniaRussian FederationRwandaSamoaSaudi ArabiaSenegalSerbiaSeychellesSierra LeoneSingaporeSlovak RepublicSloveniaSmall statesSomaliaSouth AfricaSouth AsiaSouth Asia (IDA & IBRD)SpainSri LankaSt. LuciaSt. Vincent and the GrenadinesSub-Saharan Africa Sub-Saharan Africa (excluding high income)Sub-Saharan Africa (IDA & IBRD countries)SudanSurinameSwedenSwitzerlandSyrian Arab RepublicTajikistanTanzaniaThailandTogoTrinidad and TobagoTunisiaTurkeyTurkmenistanUgandaUkraineUnited Arab EmiratesUnited KingdomUnited StatesUpper middle incomeUruguayUzbekistanVenezuela, RBVietnamWorldYemen, Rep.ZambiaZimbabwe Timeline:
This timeline shows a graph from 1961 to 2015 of Arab World. No data until 1960. Number of actual observations by date: 55.
Source name:
World Development Indicators
Source organization:
World Bank staff estimates based data from International Monetary Fund's Direction of Trade database.
Categories, topics:
Private Sector, Trade
Last updated:
apr 23, 2017
Indicators value changes by year
At the date of observation
Value
Absolute change
Change from previous value
jan 1, 1961
8.51
+8.51
0.0%
jan 1, 1962
8.703
+0.193
2.27%
jan 1, 1963
7.578
-1.125
-12.93%
jan 1, 1964
8.066
+0.488
6.43%
jan 1, 1965
9.369
+1.303
16.16%
jan 1, 1966
8.948
-0.421
-4.49%
jan 1, 1967
6.9
-2.048
-22.89%
jan 1, 1968
6.988
+0.088
1.27%
jan 1, 1969
6.599
-0.389
-5.57%
jan 1, 1970
6.187
-0.412
-6.24%
jan 1, 1971
6.013
-0.174
-2.82%
jan 1, 1972
5.888
-0.125
-2.07%
jan 1, 1973
5.877
-0.012
-0.2%
jan 1, 1974
5.31
-0.566
-9.64%
jan 1, 1975
3.855
-1.455
-27.4%
jan 1, 1976
4.234
+0.378
9.82%
jan 1, 1977
3.875
-0.359
-8.48%
jan 1, 1978
4.404
+0.529
13.66%
jan 1, 1979
3.851
-0.553
-12.56%
jan 1, 1980
4.149
+0.298
7.74%
jan 1, 1981
3.94
-0.209
-5.04%
jan 1, 1982
5.92
+1.981
50.28%
jan 1, 1983
6.373
+0.452
7.64%
jan 1, 1984
6.023
-0.35
-5.49%
jan 1, 1985
6.245
+0.222
3.69%
jan 1, 1986
6.452
+0.207
3.31%
jan 1, 1987
9.397
+2.945
45.65%
jan 1, 1988
9.124
-0.273
-2.91%
jan 1, 1989
10.343
+1.219
13.36%
jan 1, 1990
10.228
-0.115
-1.11%
jan 1, 1991
9.863
-0.365
-3.57%
jan 1, 1992
8.522
-1.341
-13.6%
jan 1, 1993
8.735
+0.214
2.51%
jan 1, 1994
9.453
+0.718
8.22%
jan 1, 1995
9.734
+0.281
2.98%
jan 1, 1996
9.666
-0.068
-0.7%
jan 1, 1997
8.869
-0.797
-8.24%
jan 1, 1998
8.685
-0.184
-2.07%
jan 1, 1999
10.556
+1.871
21.54%
jan 1, 2000
8.561
-1.995
-18.9%
jan 1, 2001
6.927
-1.634
-19.09%
jan 1, 2002
8.257
+1.331
19.21%
jan 1, 2003
9.072
+0.815
9.87%
jan 1, 2004
7.979
-1.093
-12.05%
jan 1, 2005
9.35
+1.371
17.19%
jan 1, 2006
8.66
-0.691
-7.39%
jan 1, 2007
8.272
-0.387
-4.47%
jan 1, 2008
8.847
+0.575
6.95%
jan 1, 2009
8.857
+0.01
0.11%
jan 1, 2010
11.342
+2.485
28.06%
jan 1, 2011
10.69
-0.652
-5.75%
jan 1, 2012
9.503
-1.187
-11.11%
jan 1, 2013
9.397
-0.106
-1.11%
jan 1, 2014
11.477
+2.079
22.13%
jan 1, 2015
12.15
+0.673
5.87%
Ranking of countries by current statistics by years


Comments: