29
/
en
AIzaSyAYiBZKx7MnpbEhh9jyipgxe19OcubqV5w
April 1, 2024
57277
South Asia
SAS
false
2
1
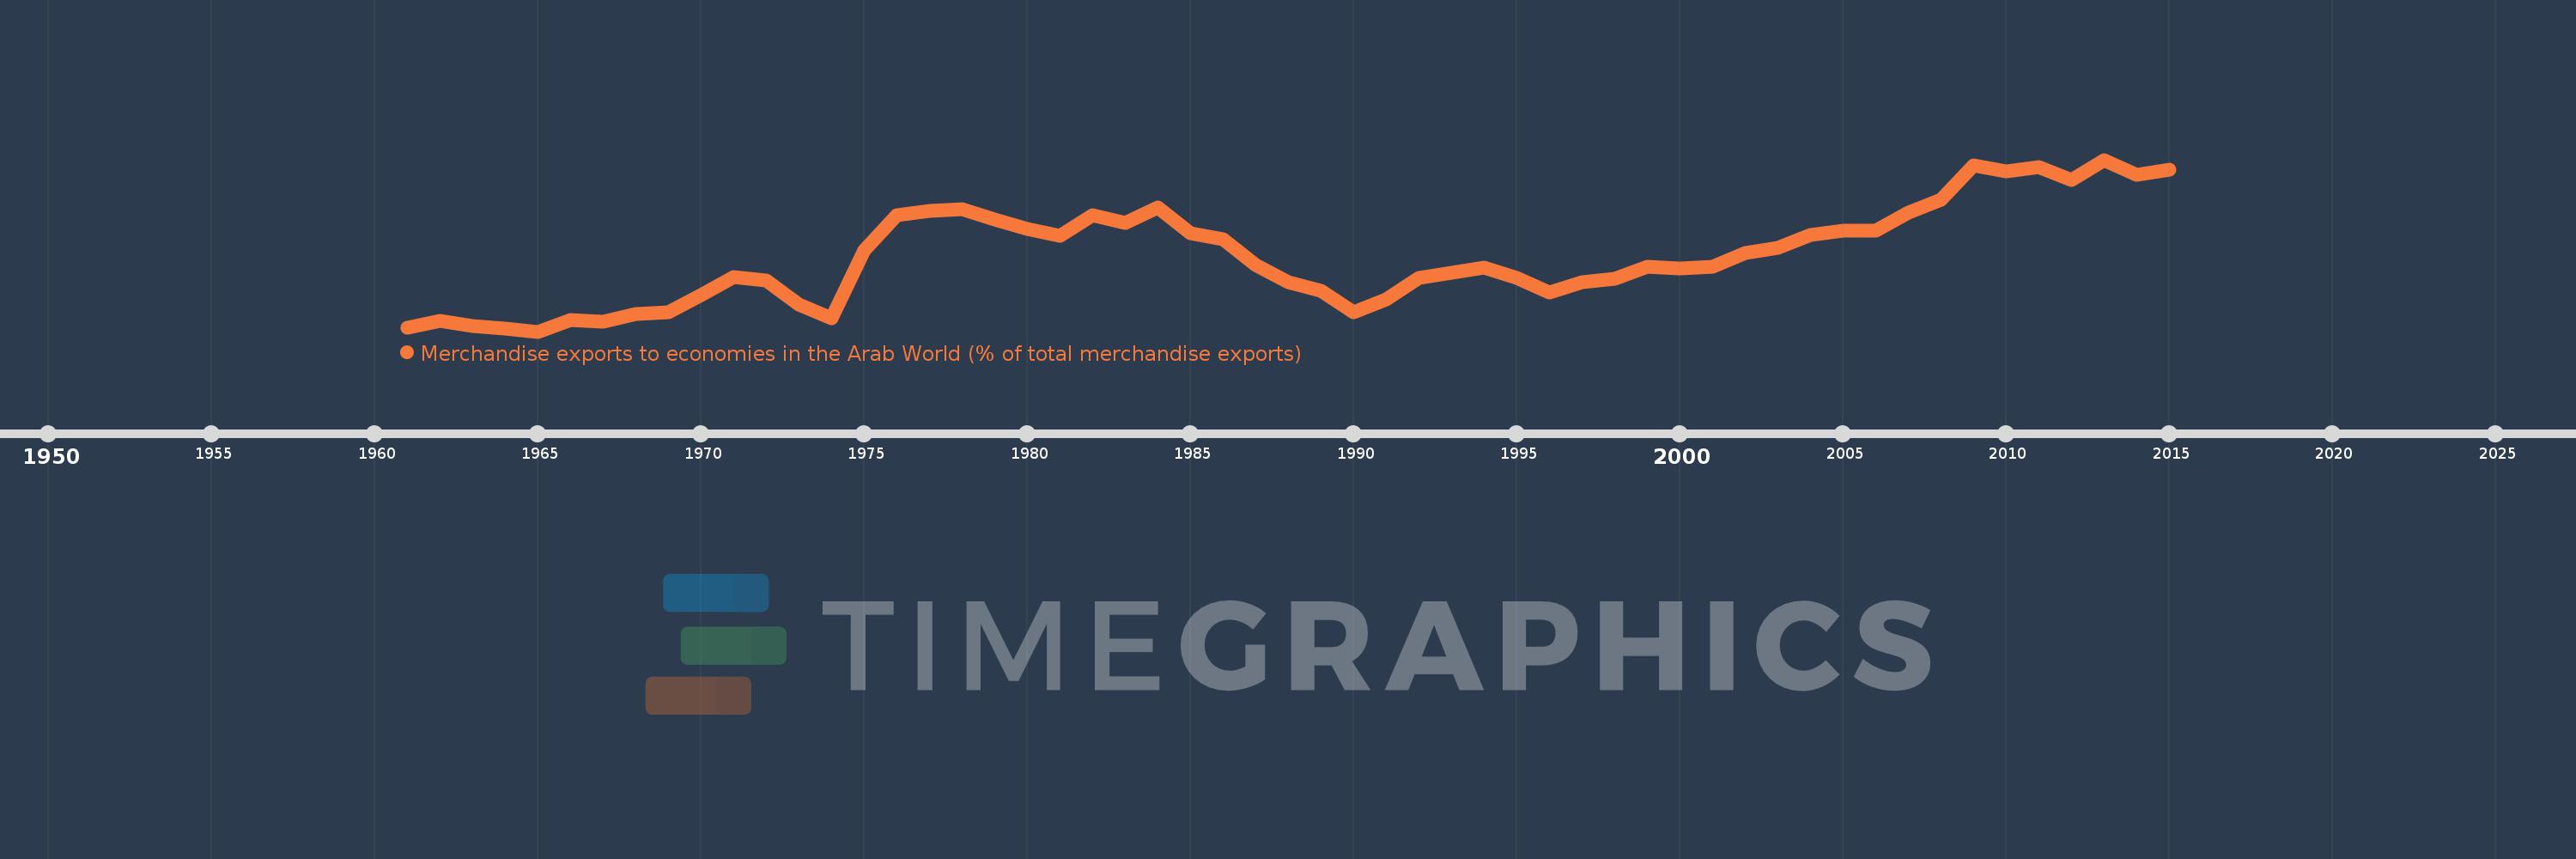
Merchandise exports to economies in the Arab World (% of total merchandise exports)
2015,2014,2013,2012,2011,2010,2009,2008,2007,2006,2005,2004,2003,2002,2001,2000,1999,1998,1997,1996,1995,1994,1993,1992,1991,1990,1989,1988,1987,1986,1985,1984,1983,1982,1981,1980,1979,1978,1977,1976,1975,1974,1973,1972,1971,1970,1969,1968,1967,1966,1965,1964,1963,1962,1961
This statistics in other country:
AfghanistanAlbaniaAlgeriaAngolaArab WorldArgentinaArmeniaArubaAustraliaAustriaAzerbaijanBahamas, TheBahrainBangladeshBarbadosBelarusBelgiumBelizeBeninBermudaBoliviaBosnia and HerzegovinaBrazilBrunei DarussalamBulgariaBurkina FasoBurundiCabo VerdeCambodiaCameroonCanadaCaribbean small statesCentral African RepublicCentral Europe and the BalticsChadChileChinaColombiaComorosCongo, Dem. Rep.Congo, Rep.Costa RicaCote d'IvoireCroatiaCubaCyprusCzech RepublicDenmarkDjiboutiDominicaDominican RepublicEarly-demographic dividendEast Asia & PacificEast Asia & Pacific (excluding high income)East Asia & Pacific (IDA & IBRD countries)EcuadorEgypt, Arab Rep.El SalvadorEstoniaEthiopiaEuro areaEurope & Central AsiaEurope & Central Asia (excluding high income)Europe & Central Asia (IDA & IBRD countries)European UnionFijiFinlandFragile and conflict affected situationsFranceGabonGambia, TheGeorgiaGermanyGhanaGreeceGreenlandGrenadaGuatemalaGuineaGuinea-BissauGuyanaHaitiHeavily indebted poor countries (HIPC)High incomeHondurasHong Kong SAR, ChinaHungaryIBRD onlyIcelandIDA & IBRD totalIDA blendIDA onlyIDA totalIndiaIndonesiaIran, Islamic Rep.IraqIrelandIsraelItalyJamaicaJapanJordanKazakhstanKenyaKorea, Dem. People’s Rep.Korea, Rep.KosovoKuwaitKyrgyz RepublicLao PDRLate-demographic dividendLatin America & Caribbean Latin America & Caribbean (excluding high income)Latin America & the Caribbean (IDA & IBRD countries)LatviaLeast developed countries: UN classificationLebanonLiberiaLibyaLithuaniaLow & middle incomeLow incomeLower middle incomeLuxembourgMacao SAR, ChinaMacedonia, FYRMadagascarMalawiMalaysiaMaldivesMaliMaltaMauritaniaMauritiusMexicoMiddle East & North AfricaMiddle East & North Africa (excluding high income)Middle East & North Africa (IDA & IBRD countries)Middle incomeMoldovaMongoliaMontenegroMoroccoMozambiqueMyanmarNepalNetherlandsNew CaledoniaNew ZealandNicaraguaNigerNigeriaNorth AmericaNorwayOECD membersOmanOther small statesPacific island small statesPakistanPanamaPapua New GuineaParaguayPeruPhilippinesPolandPortugalPost-demographic dividendPre-demographic dividendQatarRomaniaRussian FederationRwandaSamoaSaudi ArabiaSenegalSerbiaSeychellesSierra LeoneSingaporeSlovak RepublicSloveniaSmall statesSomaliaSouth AfricaSouth AsiaSouth Asia (IDA & IBRD)SpainSri LankaSt. LuciaSt. Vincent and the GrenadinesSub-Saharan Africa Sub-Saharan Africa (excluding high income)Sub-Saharan Africa (IDA & IBRD countries)SudanSurinameSwedenSwitzerlandSyrian Arab RepublicTajikistanTanzaniaThailandTogoTrinidad and TobagoTunisiaTurkeyTurkmenistanUgandaUkraineUnited Arab EmiratesUnited KingdomUnited StatesUpper middle incomeUruguayUzbekistanVenezuela, RBVietnamWorldYemen, Rep.ZambiaZimbabwe Timeline:
This timeline shows a graph from 1961 to 2015 of South Asia. No data until 1960. Number of actual observations by date: 55.
Source name:
World Development Indicators
Source organization:
World Bank staff estimates based data from International Monetary Fund's Direction of Trade database.
Categories, topics:
Private Sector, Trade
Last updated:
apr 23, 2017
Indicators value changes by year
Maximum:
18.402
jan 1, 2013
At the date of observation
Value
Absolute change
Change from previous value
jan 1, 1961
5.029
+5.029
0.0%
jan 1, 1962
5.594
+0.565
11.24%
jan 1, 1963
5.18
-0.414
-7.4%
jan 1, 1964
4.967
-0.213
-4.1%
jan 1, 1965
4.707
-0.261
-5.25%
jan 1, 1966
5.643
+0.936
19.89%
jan 1, 1967
5.472
-0.171
-3.03%
jan 1, 1968
6.141
+0.669
12.22%
jan 1, 1969
6.214
+0.073
1.2%
jan 1, 1970
7.6
+1.386
22.3%
jan 1, 1971
9.081
+1.481
19.49%
jan 1, 1972
8.803
-0.278
-3.06%
jan 1, 1973
6.869
-1.934
-21.97%
jan 1, 1974
5.752
-1.117
-16.26%
jan 1, 1975
11.199
+5.448
94.72%
jan 1, 1976
13.974
+2.774
24.77%
jan 1, 1977
14.328
+0.354
2.54%
jan 1, 1978
14.479
+0.151
1.05%
jan 1, 1979
13.674
-0.805
-5.56%
jan 1, 1980
12.909
-0.764
-5.59%
jan 1, 1981
12.341
-0.568
-4.4%
jan 1, 1982
14.016
+1.675
13.57%
jan 1, 1983
13.339
-0.677
-4.83%
jan 1, 1984
14.62
+1.281
9.6%
jan 1, 1985
12.55
-2.07
-14.16%
jan 1, 1986
12.09
-0.459
-3.66%
jan 1, 1987
9.992
-2.098
-17.36%
jan 1, 1988
8.644
-1.348
-13.49%
jan 1, 1989
7.942
-0.701
-8.11%
jan 1, 1990
6.257
-1.686
-21.22%
jan 1, 1991
7.284
+1.028
16.42%
jan 1, 1992
8.97
+1.686
23.14%
jan 1, 1993
9.424
+0.454
5.06%
jan 1, 1994
9.81
+0.386
4.1%
jan 1, 1995
8.996
-0.814
-8.29%
jan 1, 1996
7.825
-1.171
-13.02%
jan 1, 1997
8.628
+0.803
10.26%
jan 1, 1998
8.911
+0.284
3.29%
jan 1, 1999
9.896
+0.984
11.05%
jan 1, 2000
9.71
-0.186
-1.88%
jan 1, 2001
9.849
+0.14
1.44%
jan 1, 2002
10.987
+1.137
11.54%
jan 1, 2003
11.355
+0.368
3.35%
jan 1, 2004
12.381
+1.026
9.03%
jan 1, 2005
12.761
+0.38
3.07%
jan 1, 2006
12.755
-0.005
-0.04%
jan 1, 2007
14.164
+1.409
11.05%
jan 1, 2008
15.212
+1.048
7.4%
jan 1, 2009
17.982
+2.769
18.2%
jan 1, 2010
17.483
-0.498
-2.77%
jan 1, 2011
17.842
+0.358
2.05%
jan 1, 2012
16.8
-1.042
-5.84%
jan 1, 2013
18.402
+1.603
9.54%
jan 1, 2014
17.19
-1.212
-6.59%
jan 1, 2015
17.613
+0.422
2.46%
Ranking of countries by current statistics by years


Comments: