29
/
en
AIzaSyAYiBZKx7MnpbEhh9jyipgxe19OcubqV5w
April 1, 2024
247802
Spain
ESP
true
2
1
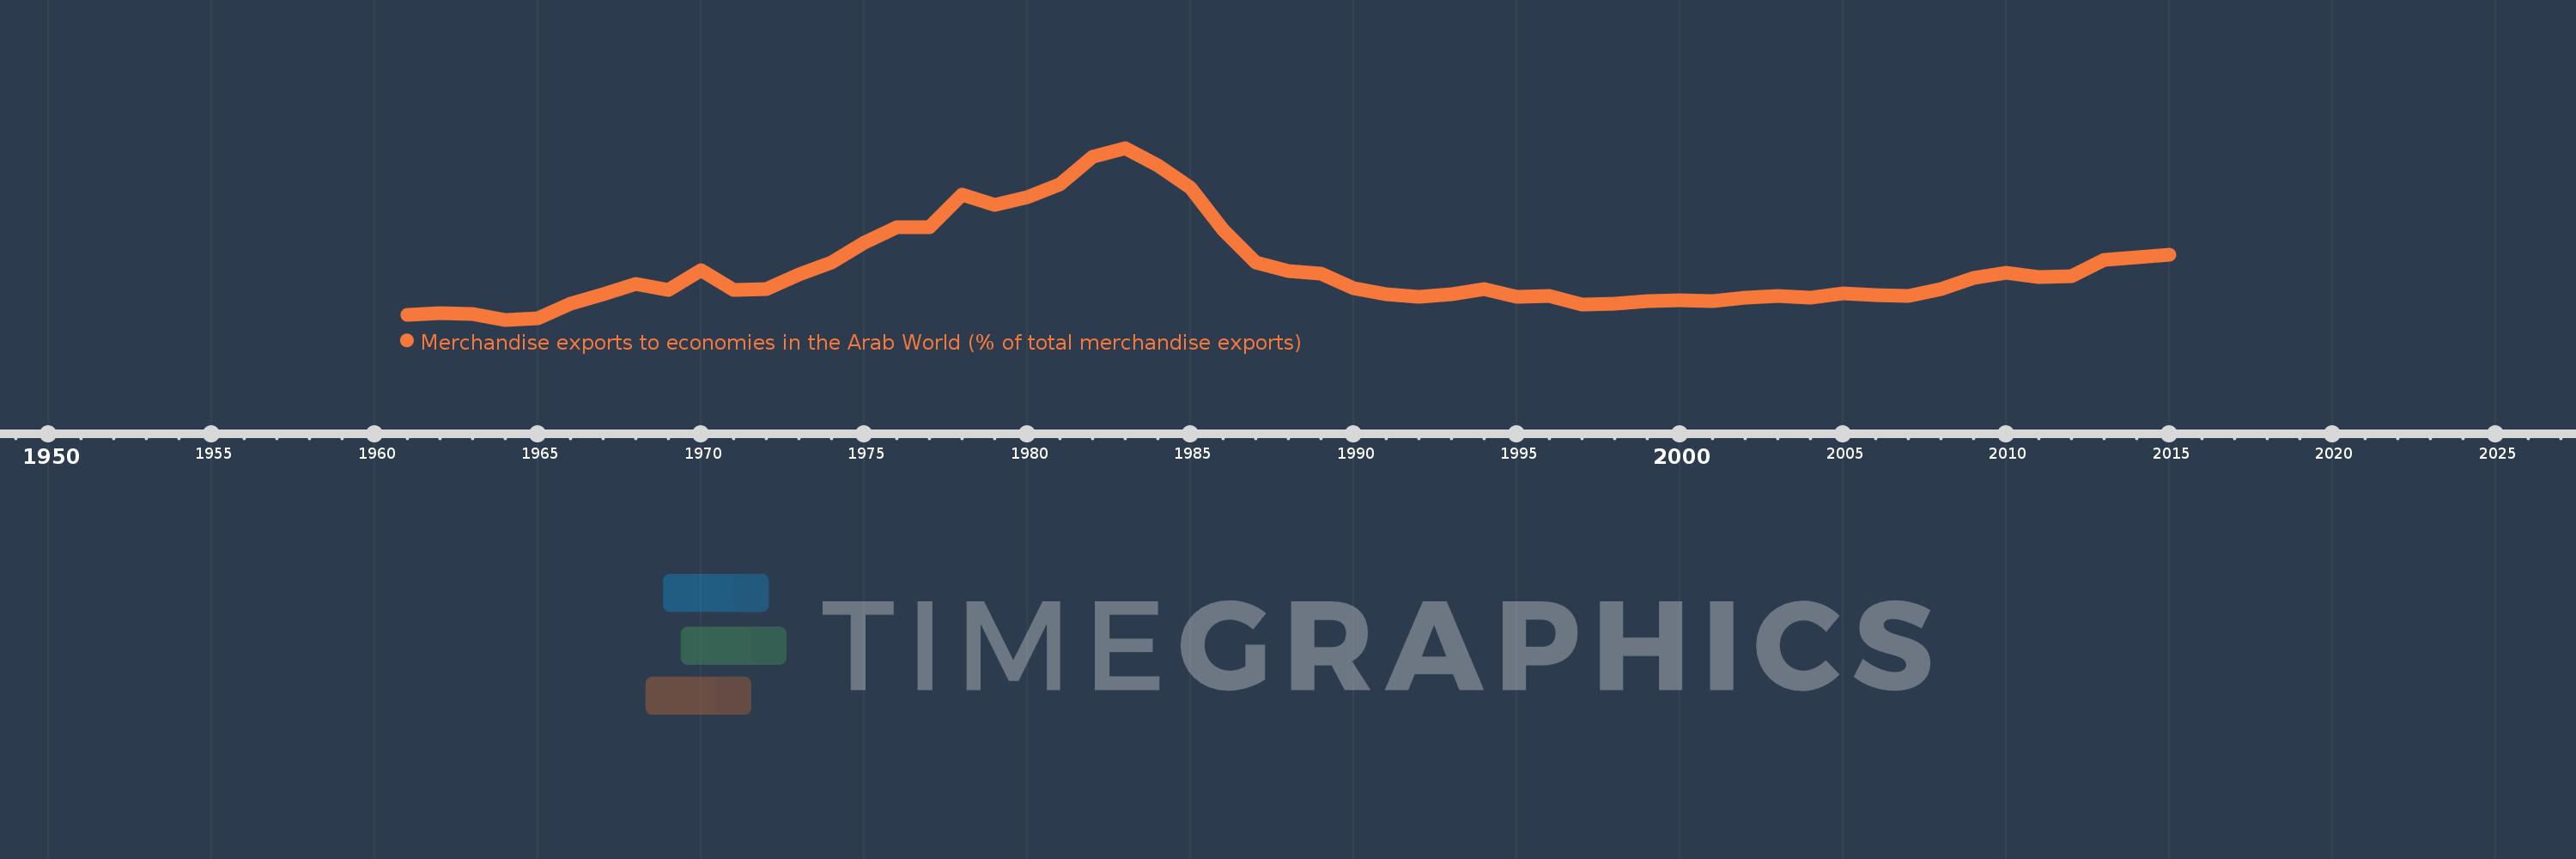
Merchandise exports to economies in the Arab World (% of total merchandise exports)
2015,2014,2013,2012,2011,2010,2009,2008,2007,2006,2005,2004,2003,2002,2001,2000,1999,1998,1997,1996,1995,1994,1993,1992,1991,1990,1989,1988,1987,1986,1985,1984,1983,1982,1981,1980,1979,1978,1977,1976,1975,1974,1973,1972,1971,1970,1969,1968,1967,1966,1965,1964,1963,1962,1961
This statistics in other country:
AfghanistanAlbaniaAlgeriaAngolaArab WorldArgentinaArmeniaArubaAustraliaAustriaAzerbaijanBahamas, TheBahrainBangladeshBarbadosBelarusBelgiumBelizeBeninBermudaBoliviaBosnia and HerzegovinaBrazilBrunei DarussalamBulgariaBurkina FasoBurundiCabo VerdeCambodiaCameroonCanadaCaribbean small statesCentral African RepublicCentral Europe and the BalticsChadChileChinaColombiaComorosCongo, Dem. Rep.Congo, Rep.Costa RicaCote d'IvoireCroatiaCubaCyprusCzech RepublicDenmarkDjiboutiDominicaDominican RepublicEarly-demographic dividendEast Asia & PacificEast Asia & Pacific (excluding high income)East Asia & Pacific (IDA & IBRD countries)EcuadorEgypt, Arab Rep.El SalvadorEstoniaEthiopiaEuro areaEurope & Central AsiaEurope & Central Asia (excluding high income)Europe & Central Asia (IDA & IBRD countries)European UnionFijiFinlandFragile and conflict affected situationsFranceGabonGambia, TheGeorgiaGermanyGhanaGreeceGreenlandGrenadaGuatemalaGuineaGuinea-BissauGuyanaHaitiHeavily indebted poor countries (HIPC)High incomeHondurasHong Kong SAR, ChinaHungaryIBRD onlyIcelandIDA & IBRD totalIDA blendIDA onlyIDA totalIndiaIndonesiaIran, Islamic Rep.IraqIrelandIsraelItalyJamaicaJapanJordanKazakhstanKenyaKorea, Dem. People’s Rep.Korea, Rep.KosovoKuwaitKyrgyz RepublicLao PDRLate-demographic dividendLatin America & Caribbean Latin America & Caribbean (excluding high income)Latin America & the Caribbean (IDA & IBRD countries)LatviaLeast developed countries: UN classificationLebanonLiberiaLibyaLithuaniaLow & middle incomeLow incomeLower middle incomeLuxembourgMacao SAR, ChinaMacedonia, FYRMadagascarMalawiMalaysiaMaldivesMaliMaltaMauritaniaMauritiusMexicoMiddle East & North AfricaMiddle East & North Africa (excluding high income)Middle East & North Africa (IDA & IBRD countries)Middle incomeMoldovaMongoliaMontenegroMoroccoMozambiqueMyanmarNepalNetherlandsNew CaledoniaNew ZealandNicaraguaNigerNigeriaNorth AmericaNorwayOECD membersOmanOther small statesPacific island small statesPakistanPanamaPapua New GuineaParaguayPeruPhilippinesPolandPortugalPost-demographic dividendPre-demographic dividendQatarRomaniaRussian FederationRwandaSamoaSaudi ArabiaSenegalSerbiaSeychellesSierra LeoneSingaporeSlovak RepublicSloveniaSmall statesSomaliaSouth AfricaSouth AsiaSouth Asia (IDA & IBRD)SpainSri LankaSt. LuciaSt. Vincent and the GrenadinesSub-Saharan Africa Sub-Saharan Africa (excluding high income)Sub-Saharan Africa (IDA & IBRD countries)SudanSurinameSwedenSwitzerlandSyrian Arab RepublicTajikistanTanzaniaThailandTogoTrinidad and TobagoTunisiaTurkeyTurkmenistanUgandaUkraineUnited Arab EmiratesUnited KingdomUnited StatesUpper middle incomeUruguayUzbekistanVenezuela, RBVietnamWorldYemen, Rep.ZambiaZimbabwe Timeline:
This timeline shows a graph from 1961 to 2015 of Spain. No data until 1960. Number of actual observations by date: 55.
Source name:
World Development Indicators
Source organization:
World Bank staff estimates based data from International Monetary Fund's Direction of Trade database.
Categories, topics:
Private Sector, Trade
Last updated:
apr 23, 2017
Indicators value changes by year
Maximum:
15.713
jan 1, 1983
At the date of observation
Value
Absolute change
Change from previous value
jan 1, 1961
2.649
+2.649
0.0%
jan 1, 1962
2.827
+0.179
6.75%
jan 1, 1963
2.725
-0.102
-3.62%
jan 1, 1964
2.296
-0.429
-15.74%
jan 1, 1965
2.431
+0.135
5.88%
jan 1, 1966
3.571
+1.14
46.89%
jan 1, 1967
4.272
+0.701
19.62%
jan 1, 1968
5.111
+0.839
19.64%
jan 1, 1969
4.654
-0.457
-8.94%
jan 1, 1970
6.147
+1.493
32.09%
jan 1, 1971
4.651
-1.495
-24.33%
jan 1, 1972
4.692
+0.041
0.87%
jan 1, 1973
5.834
+1.142
24.34%
jan 1, 1974
6.802
+0.968
16.59%
jan 1, 1975
8.314
+1.512
22.24%
jan 1, 1976
9.55
+1.236
14.87%
jan 1, 1977
9.526
-0.024
-0.25%
jan 1, 1978
12.078
+2.552
26.79%
jan 1, 1979
11.236
-0.842
-6.97%
jan 1, 1980
11.902
+0.666
5.92%
jan 1, 1981
12.843
+0.941
7.91%
jan 1, 1982
15.046
+2.203
17.15%
jan 1, 1983
15.713
+0.667
4.43%
jan 1, 1984
14.333
-1.38
-8.78%
jan 1, 1985
12.631
-1.702
-11.87%
jan 1, 1986
9.318
-3.313
-26.23%
jan 1, 1987
6.796
-2.522
-27.06%
jan 1, 1988
6.107
-0.689
-10.14%
jan 1, 1989
5.899
-0.208
-3.4%
jan 1, 1990
4.782
-1.117
-18.93%
jan 1, 1991
4.279
-0.504
-10.53%
jan 1, 1992
4.069
-0.21
-4.91%
jan 1, 1993
4.277
+0.208
5.12%
jan 1, 1994
4.712
+0.435
10.18%
jan 1, 1995
4.114
-0.598
-12.69%
jan 1, 1996
4.146
+0.032
0.77%
jan 1, 1997
3.5
-0.646
-15.58%
jan 1, 1998
3.551
+0.051
1.46%
jan 1, 1999
3.778
+0.228
6.41%
jan 1, 2000
3.832
+0.054
1.42%
jan 1, 2001
3.726
-0.106
-2.76%
jan 1, 2002
4.024
+0.298
8.0%
jan 1, 2003
4.187
+0.163
4.05%
jan 1, 2004
4.029
-0.158
-3.78%
jan 1, 2005
4.383
+0.354
8.79%
jan 1, 2006
4.209
-0.174
-3.98%
jan 1, 2007
4.173
-0.036
-0.84%
jan 1, 2008
4.683
+0.51
12.21%
jan 1, 2009
5.59
+0.907
19.37%
jan 1, 2010
5.96
+0.37
6.62%
jan 1, 2011
5.653
-0.307
-5.15%
jan 1, 2012
5.726
+0.073
1.29%
jan 1, 2013
6.941
+1.215
21.21%
jan 1, 2014
7.156
+0.216
3.11%
jan 1, 2015
7.384
+0.227
3.18%
Ranking of countries by current statistics by years


Comments: