29
/
en
AIzaSyAYiBZKx7MnpbEhh9jyipgxe19OcubqV5w
April 1, 2024
89446
Botswana
BWA
true
2
1
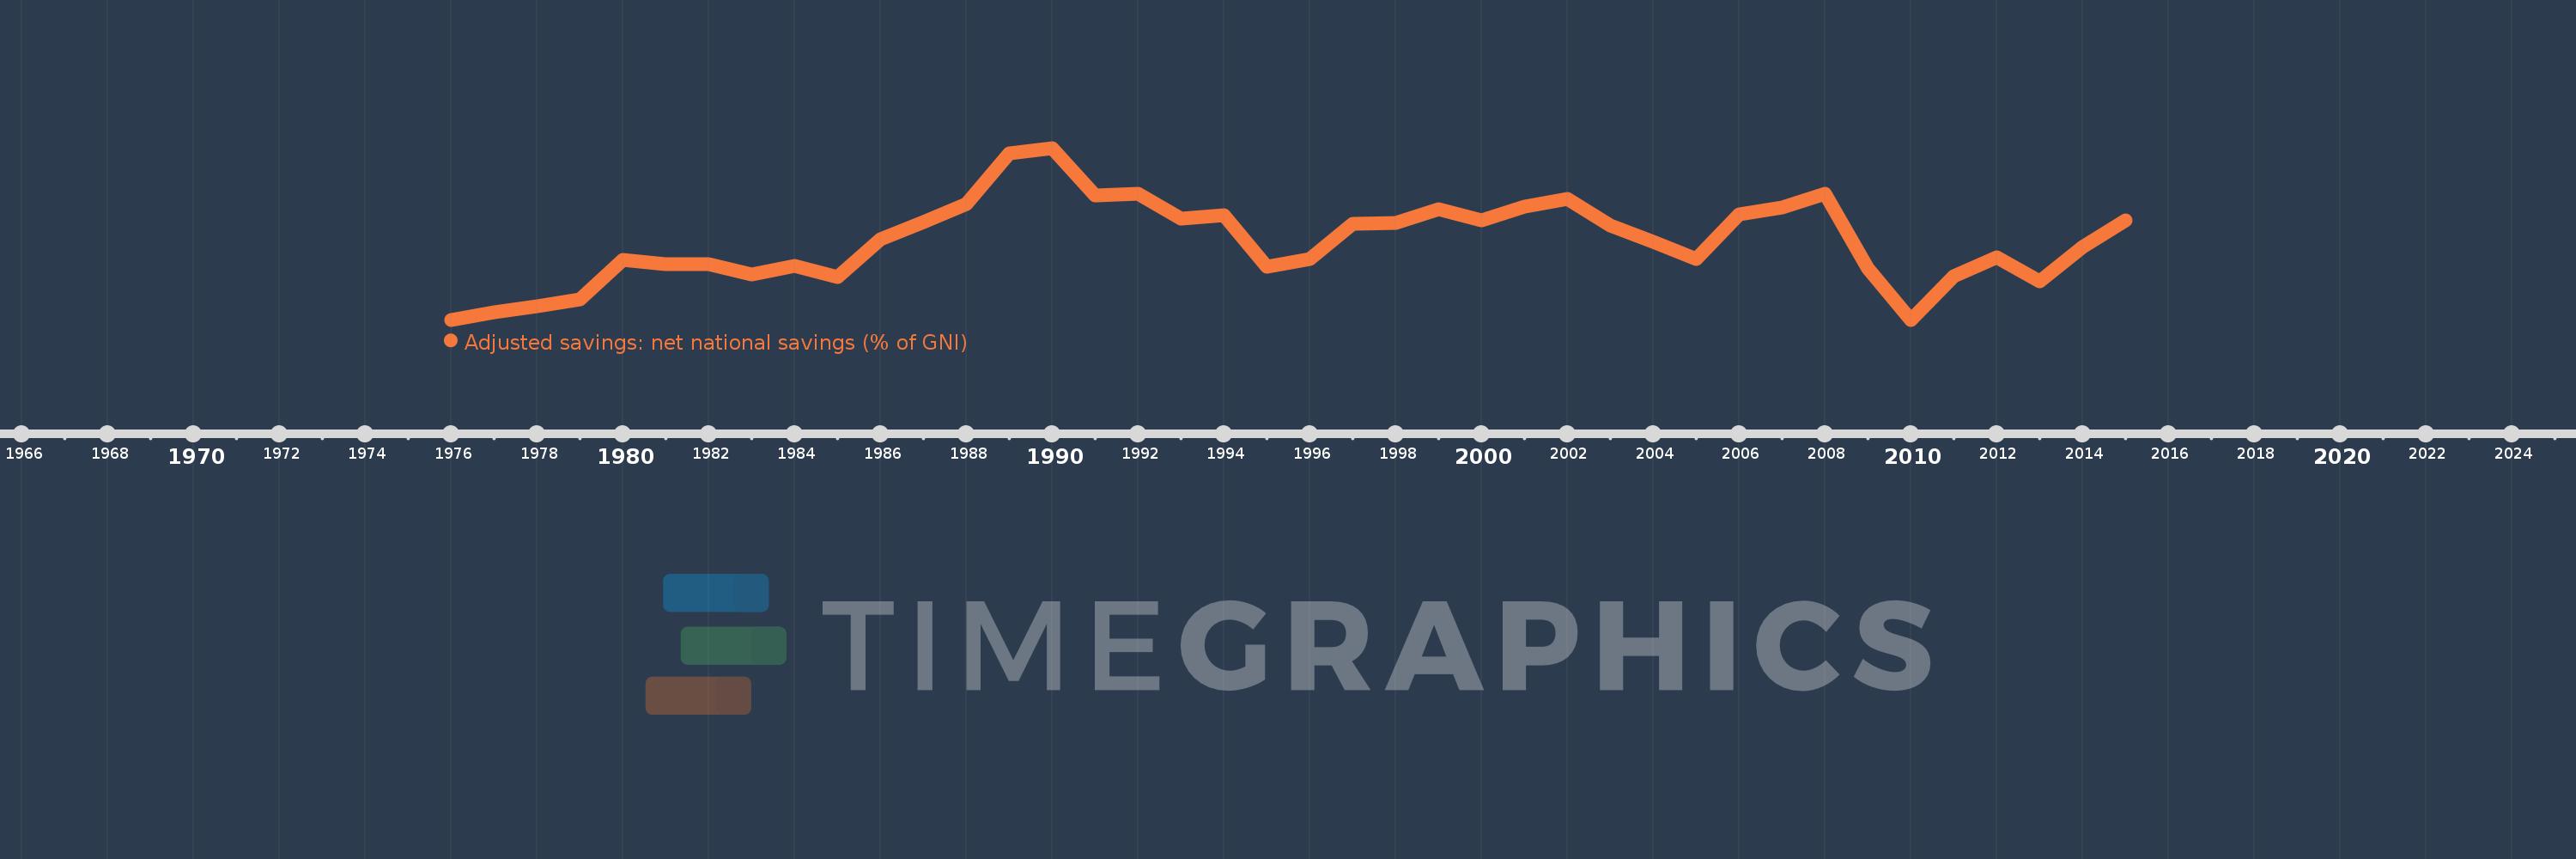
Adjusted savings: net national savings (% of GNI)
2015,2014,2013,2012,2011,2010,2009,2008,2007,2006,2005,2004,2003,2002,2001,2000,1999,1998,1997,1996,1995,1994,1993,1992,1991,1990,1989,1988,1987,1986,1985,1984,1983,1982,1981,1980,1979,1978,1977,1976
This statistics in other country:
AfghanistanAlbaniaAlgeriaAngolaAntigua and BarbudaArab WorldArgentinaArmeniaAustraliaAustriaAzerbaijanBahamas, TheBahrainBangladeshBarbadosBelarusBelgiumBelizeBeninBermudaBhutanBoliviaBosnia and HerzegovinaBotswanaBrazilBrunei DarussalamBulgariaBurkina FasoBurundiCabo VerdeCambodiaCameroonCanadaCaribbean small statesCentral African RepublicCentral Europe and the BalticsChadChileChinaColombiaComorosCongo, Dem. Rep.Congo, Rep.Costa RicaCote d'IvoireCroatiaCyprusCzech RepublicDenmarkDjiboutiDominicaDominican RepublicEarly-demographic dividendEast Asia & PacificEast Asia & Pacific (excluding high income)East Asia & Pacific (IDA & IBRD countries)EcuadorEgypt, Arab Rep.El SalvadorEquatorial GuineaEritreaEstoniaEthiopiaEuro areaEurope & Central AsiaEurope & Central Asia (excluding high income)Europe & Central Asia (IDA & IBRD countries)European UnionFijiFinlandFragile and conflict affected situationsFranceGabonGambia, TheGeorgiaGermanyGhanaGreeceGrenadaGuatemalaGuineaGuinea-BissauGuyanaHaitiHeavily indebted poor countries (HIPC)High incomeHondurasHong Kong SAR, ChinaHungaryIBRD onlyIcelandIDA & IBRD totalIDA blendIDA onlyIDA totalIndiaIndonesiaIran, Islamic Rep.IraqIrelandIsraelItalyJamaicaJapanJordanKazakhstanKenyaKiribatiKorea, Rep.KosovoKuwaitKyrgyz RepublicLao PDRLate-demographic dividendLatin America & Caribbean Latin America & Caribbean (excluding high income)Latin America & the Caribbean (IDA & IBRD countries)LatviaLeast developed countries: UN classificationLebanonLesothoLiberiaLibyaLithuaniaLow & middle incomeLow incomeLower middle incomeLuxembourgMacao SAR, ChinaMacedonia, FYRMadagascarMalawiMalaysiaMaldivesMaliMaltaMauritaniaMauritiusMexicoMiddle East & North AfricaMiddle East & North Africa (excluding high income)Middle East & North Africa (IDA & IBRD countries)Middle incomeMoldovaMongoliaMontenegroMoroccoMozambiqueNamibiaNepalNetherlandsNew ZealandNicaraguaNigerNigeriaNorth AmericaNorwayOECD membersOmanOther small statesPacific island small statesPakistanPanamaPapua New GuineaParaguayPeruPhilippinesPolandPortugalPost-demographic dividendPre-demographic dividendQatarRomaniaRussian FederationRwandaSaudi ArabiaSenegalSerbiaSeychellesSierra LeoneSingaporeSlovak RepublicSloveniaSmall statesSolomon IslandsSouth AfricaSouth AsiaSouth Asia (IDA & IBRD)SpainSri LankaSt. Kitts and NevisSt. LuciaSt. Vincent and the GrenadinesSub-Saharan Africa Sub-Saharan Africa (excluding high income)Sub-Saharan Africa (IDA & IBRD countries)SudanSurinameSwazilandSwedenSwitzerlandSyrian Arab RepublicTajikistanTanzaniaThailandTimor-LesteTogoTongaTrinidad and TobagoTunisiaTurkeyTurkmenistanUgandaUkraineUnited KingdomUnited StatesUpper middle incomeUruguayVanuatuVenezuela, RBVietnamWest Bank and GazaWorldYemen, Rep.ZambiaZimbabwe Timeline:
This timeline shows a graph from 1976 to 2015 of Botswana. No data until 1975. Number of actual observations by date: 40.
Source name:
World Development Indicators
Source organization:
World Bank staff estimates based on sources and methods in World Bank's "The Changing Wealth of Nations: Measuring Sustainable Development in the New Millennium" (2011).
Categories, topics:
Economy & Growth, Environment
Last updated:
apr 23, 2017
Indicators value changes by year
Maximum:
42.511
jan 1, 1990
At the date of observation
Value
Absolute change
Change from previous value
jan 1, 1977
7.417
+1.517
25.71%
jan 1, 1978
8.671
+1.254
16.91%
jan 1, 1979
10.219
+1.549
17.86%
jan 1, 1980
18.599
+8.38
82.0%
jan 1, 1981
17.67
-0.929
-5.0%
jan 1, 1982
17.764
+0.094
0.53%
jan 1, 1983
15.537
-2.227
-12.54%
jan 1, 1984
17.417
+1.881
12.1%
jan 1, 1985
14.938
-2.479
-14.23%
jan 1, 1986
23.102
+8.164
54.65%
jan 1, 1987
26.755
+3.652
15.81%
jan 1, 1988
30.477
+3.722
13.91%
jan 1, 1989
41.429
+10.953
35.94%
jan 1, 1990
42.511
+1.081
2.61%
jan 1, 1991
32.403
-10.108
-23.78%
jan 1, 1992
32.806
+0.404
1.25%
jan 1, 1993
27.439
-5.367
-16.36%
jan 1, 1994
28.192
+0.753
2.74%
jan 1, 1995
17.098
-11.094
-39.35%
jan 1, 1996
18.798
+1.7
9.94%
jan 1, 1997
26.377
+7.58
40.32%
jan 1, 1998
26.602
+0.225
0.85%
jan 1, 1999
29.398
+2.795
10.51%
jan 1, 2000
27.054
-2.343
-7.97%
jan 1, 2001
29.921
+2.867
10.6%
jan 1, 2002
31.661
+1.74
5.82%
jan 1, 2003
25.985
-5.676
-17.93%
jan 1, 2004
22.445
-3.54
-13.62%
jan 1, 2005
18.76
-3.684
-16.41%
jan 1, 2006
28.363
+9.602
51.18%
jan 1, 2007
29.818
+1.455
5.13%
jan 1, 2008
32.81
+2.992
10.04%
jan 1, 2009
16.763
-16.047
-48.91%
jan 1, 2010
5.885
-10.878
-64.89%
jan 1, 2011
15.13
+9.245
157.11%
jan 1, 2012
19.155
+4.025
26.6%
jan 1, 2013
14.144
-5.01
-26.16%
jan 1, 2014
21.308
+7.164
50.65%
jan 1, 2015
27.032
+5.724
26.86%
Ranking of countries by current statistics by years


Comments: