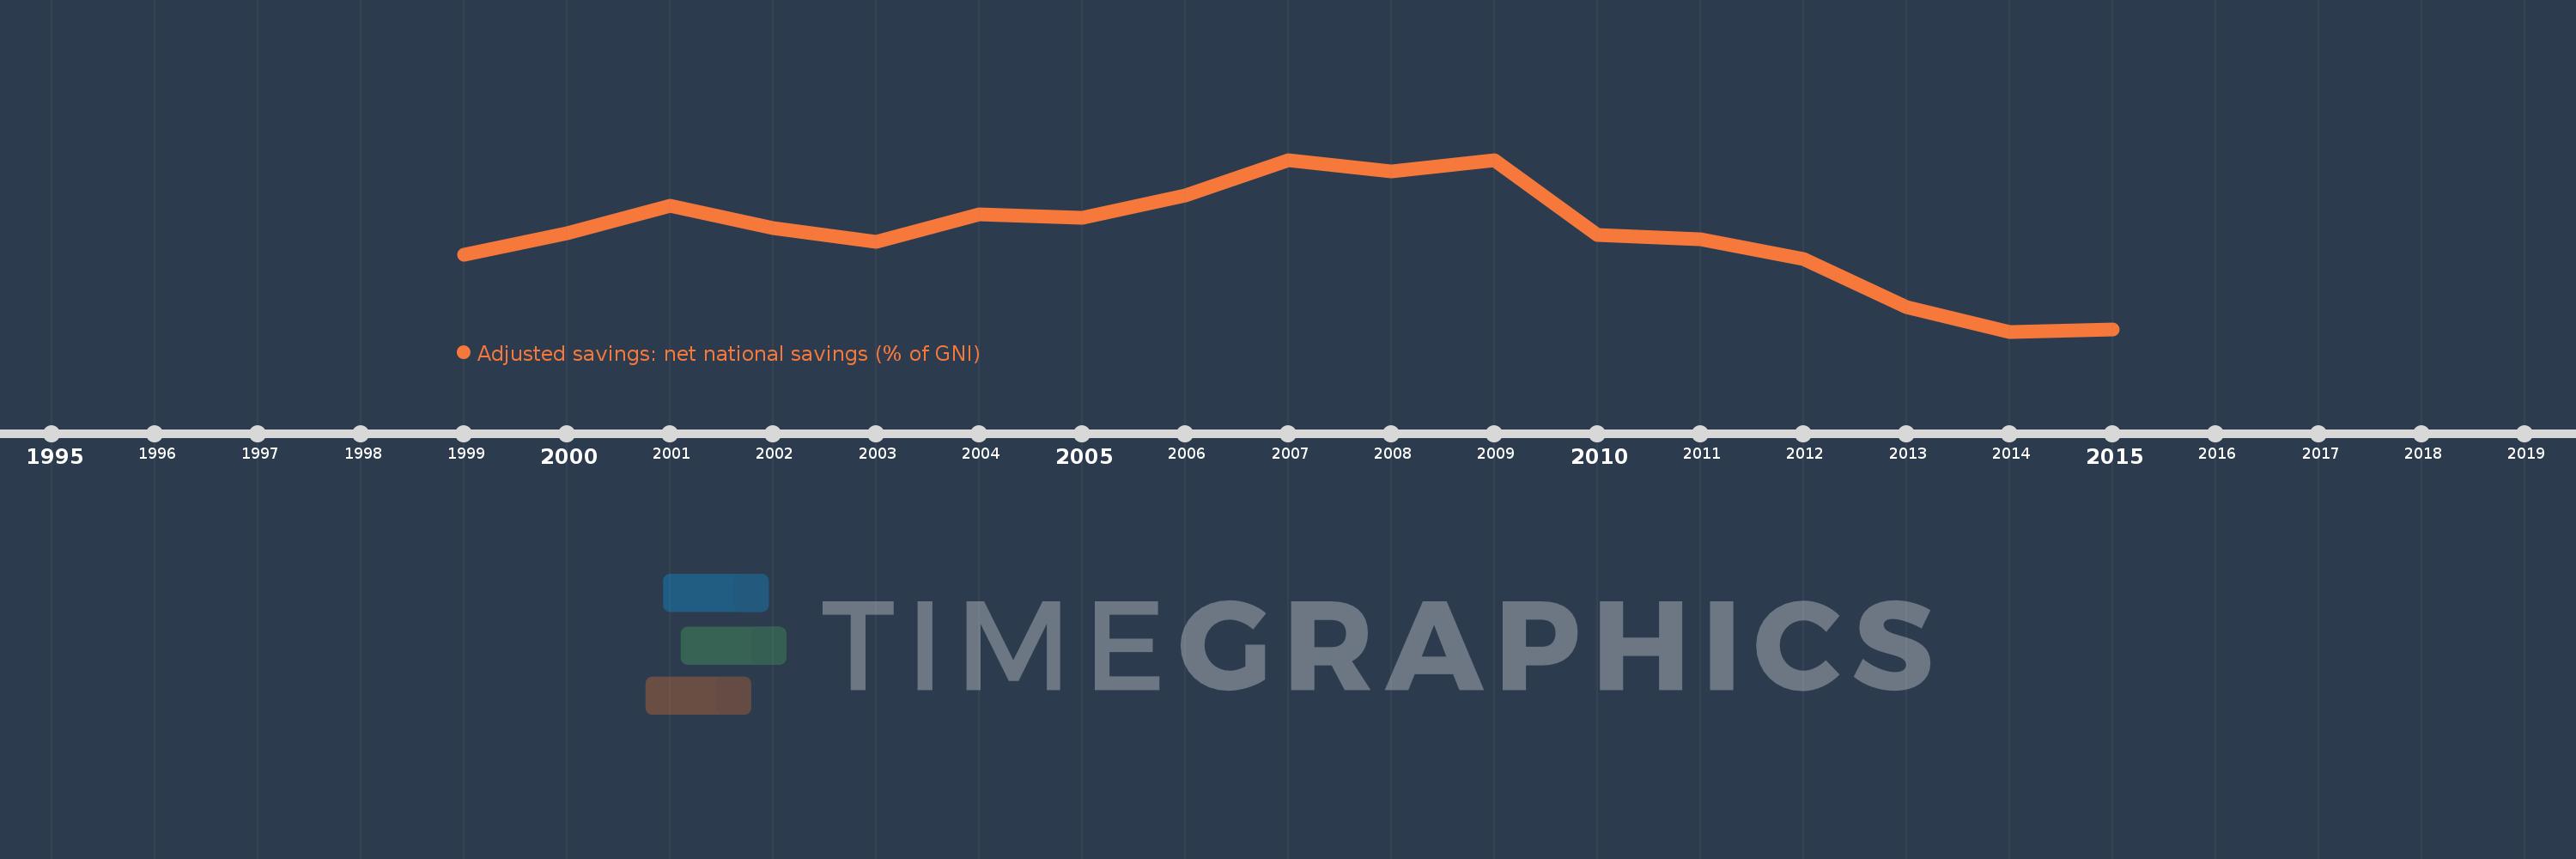
This timeline shows a graph from 1999 to 2015 of Hong Kong SAR, China. No data until 1998. Number of actual observations by date: 17.
Source name:
World Development Indicators
Source organization:
World Bank staff estimates based on sources and methods in World Bank's "The Changing Wealth of Nations: Measuring Sustainable Development in the New Millennium" (2011).
Categories, topics:
Economy & Growth, Environment
Last updated:
apr 23, 2017
Indicators value changes by year
Meaning:
18.811
Minimum:
13.211
jan 1, 2014
Maximum:
23.096
jan 1, 2009
At the date of observation
Value
Absolute change
Change from the previous value
jan 1, 1999
17.634
+17.634
0.0%
jan 1, 2000
18.891
+1.257
7.13%
jan 1, 2001
20.443
+1.552
8.22%
jan 1, 2002
19.179
-1.264
-6.18%
jan 1, 2003
18.374
-0.805
-4.2%
jan 1, 2004
19.976
+1.602
8.72%
jan 1, 2005
19.779
-0.197
-0.99%
jan 1, 2006
21.066
+1.287
6.51%
jan 1, 2007
23.062
+1.996
9.48%
jan 1, 2008
22.429
-0.633
-2.75%
jan 1, 2009
23.096
+0.668
2.98%
jan 1, 2010
18.788
-4.308
-18.65%
jan 1, 2011
18.522
-0.265
-1.41%
jan 1, 2012
17.366
-1.157
-6.24%
jan 1, 2013
14.628
-2.738
-15.77%
jan 1, 2014
13.211
-1.417
-9.68%
jan 1, 2015
13.35
+0.139
1.05%
Ranking of countries by current statistics by years
