29
/
en
AIzaSyAYiBZKx7MnpbEhh9jyipgxe19OcubqV5w
April 1, 2024
207646
Netherlands
NLD
true
2
1
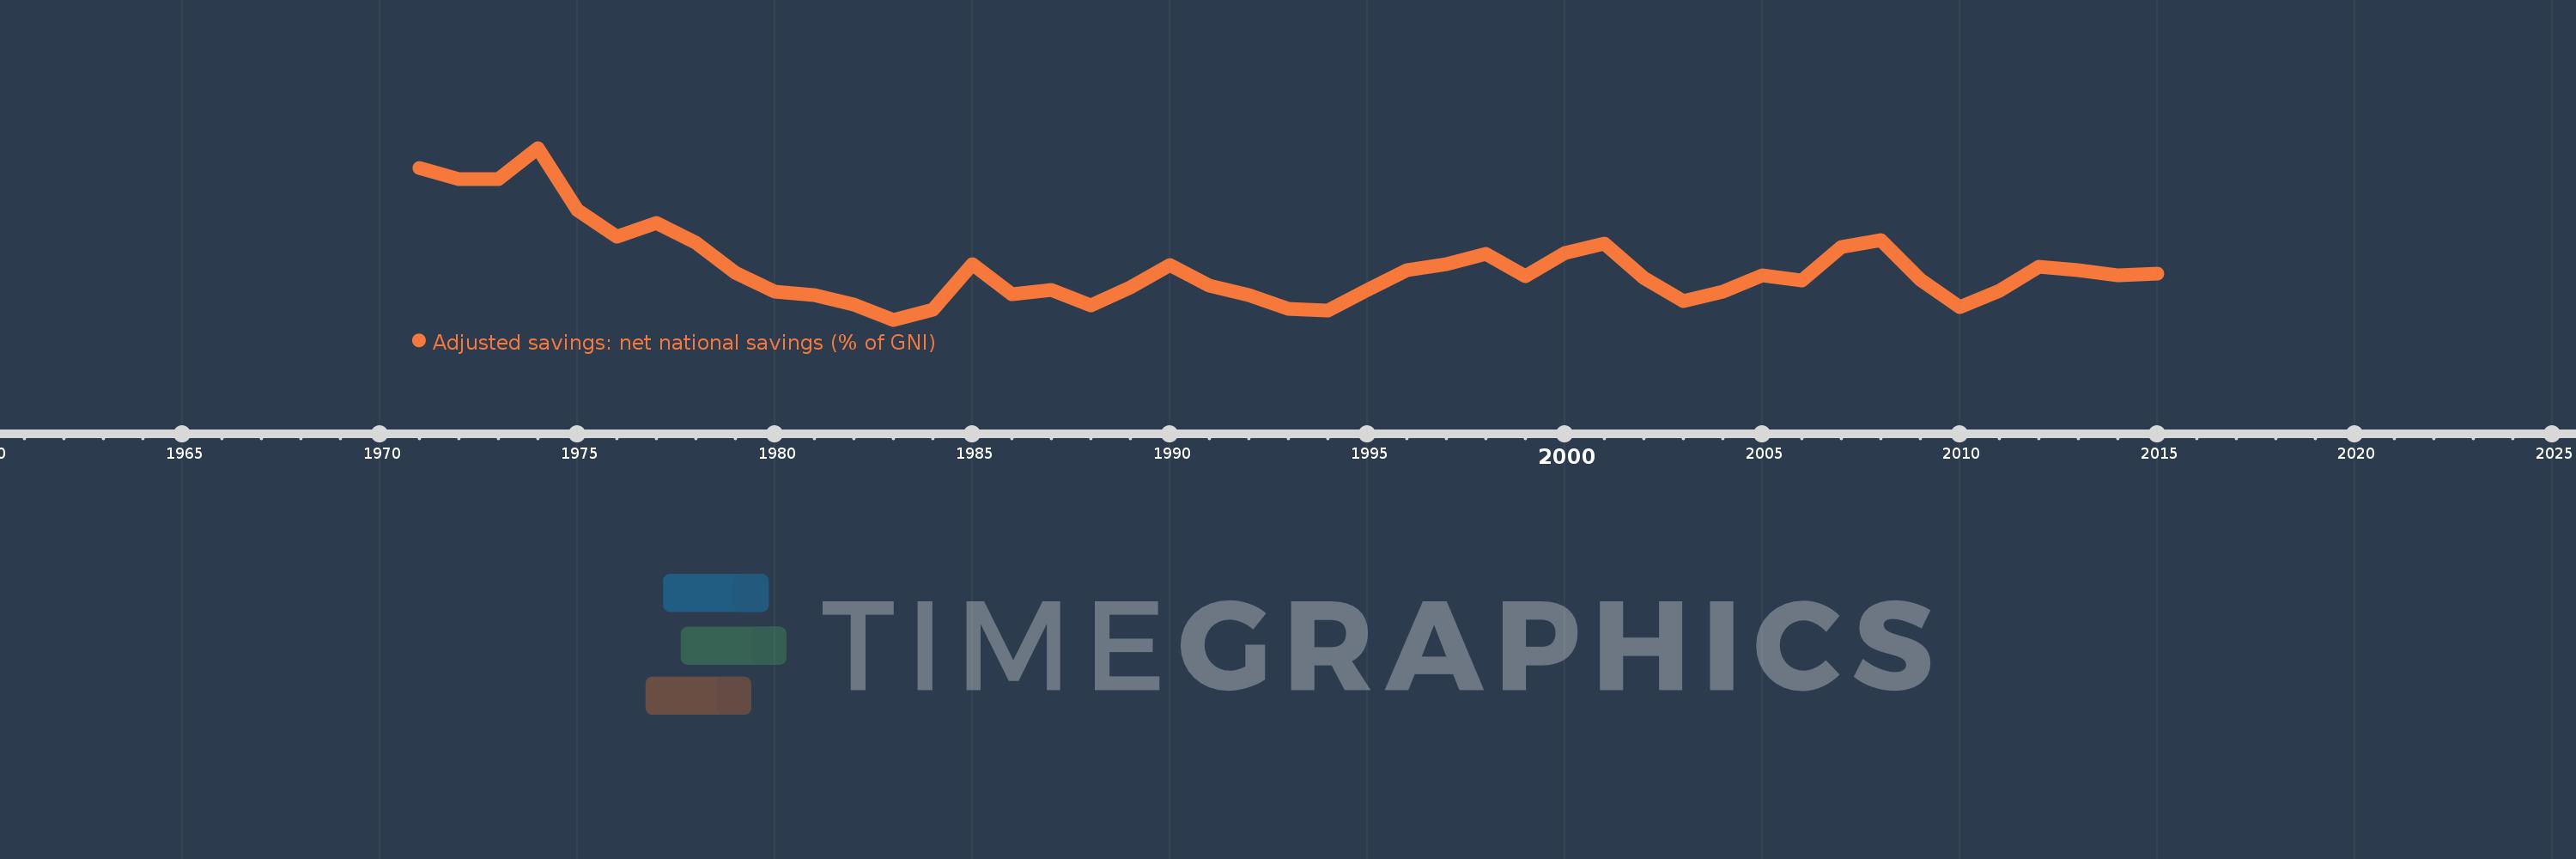
Adjusted savings: net national savings (% of GNI)
2015,2014,2013,2012,2011,2010,2009,2008,2007,2006,2005,2004,2003,2002,2001,2000,1999,1998,1997,1996,1995,1994,1993,1992,1991,1990,1989,1988,1987,1986,1985,1984,1983,1982,1981,1980,1979,1978,1977,1976,1975,1974,1973,1972,1971
This statistics in other country:
AfghanistanAlbaniaAlgeriaAngolaAntigua and BarbudaArab WorldArgentinaArmeniaAustraliaAustriaAzerbaijanBahamas, TheBahrainBangladeshBarbadosBelarusBelgiumBelizeBeninBermudaBhutanBoliviaBosnia and HerzegovinaBotswanaBrazilBrunei DarussalamBulgariaBurkina FasoBurundiCabo VerdeCambodiaCameroonCanadaCaribbean small statesCentral African RepublicCentral Europe and the BalticsChadChileChinaColombiaComorosCongo, Dem. Rep.Congo, Rep.Costa RicaCote d'IvoireCroatiaCyprusCzech RepublicDenmarkDjiboutiDominicaDominican RepublicEarly-demographic dividendEast Asia & PacificEast Asia & Pacific (excluding high income)East Asia & Pacific (IDA & IBRD countries)EcuadorEgypt, Arab Rep.El SalvadorEquatorial GuineaEritreaEstoniaEthiopiaEuro areaEurope & Central AsiaEurope & Central Asia (excluding high income)Europe & Central Asia (IDA & IBRD countries)European UnionFijiFinlandFragile and conflict affected situationsFranceGabonGambia, TheGeorgiaGermanyGhanaGreeceGrenadaGuatemalaGuineaGuinea-BissauGuyanaHaitiHeavily indebted poor countries (HIPC)High incomeHondurasHong Kong SAR, ChinaHungaryIBRD onlyIcelandIDA & IBRD totalIDA blendIDA onlyIDA totalIndiaIndonesiaIran, Islamic Rep.IraqIrelandIsraelItalyJamaicaJapanJordanKazakhstanKenyaKiribatiKorea, Rep.KosovoKuwaitKyrgyz RepublicLao PDRLate-demographic dividendLatin America & Caribbean Latin America & Caribbean (excluding high income)Latin America & the Caribbean (IDA & IBRD countries)LatviaLeast developed countries: UN classificationLebanonLesothoLiberiaLibyaLithuaniaLow & middle incomeLow incomeLower middle incomeLuxembourgMacao SAR, ChinaMacedonia, FYRMadagascarMalawiMalaysiaMaldivesMaliMaltaMauritaniaMauritiusMexicoMiddle East & North AfricaMiddle East & North Africa (excluding high income)Middle East & North Africa (IDA & IBRD countries)Middle incomeMoldovaMongoliaMontenegroMoroccoMozambiqueNamibiaNepalNetherlandsNew ZealandNicaraguaNigerNigeriaNorth AmericaNorwayOECD membersOmanOther small statesPacific island small statesPakistanPanamaPapua New GuineaParaguayPeruPhilippinesPolandPortugalPost-demographic dividendPre-demographic dividendQatarRomaniaRussian FederationRwandaSaudi ArabiaSenegalSerbiaSeychellesSierra LeoneSingaporeSlovak RepublicSloveniaSmall statesSolomon IslandsSouth AfricaSouth AsiaSouth Asia (IDA & IBRD)SpainSri LankaSt. Kitts and NevisSt. LuciaSt. Vincent and the GrenadinesSub-Saharan Africa Sub-Saharan Africa (excluding high income)Sub-Saharan Africa (IDA & IBRD countries)SudanSurinameSwazilandSwedenSwitzerlandSyrian Arab RepublicTajikistanTanzaniaThailandTimor-LesteTogoTongaTrinidad and TobagoTunisiaTurkeyTurkmenistanUgandaUkraineUnited KingdomUnited StatesUpper middle incomeUruguayVanuatuVenezuela, RBVietnamWest Bank and GazaWorldYemen, Rep.ZambiaZimbabwe Timeline:
This timeline shows a graph from 1971 to 2015 of Netherlands. No data until 1970. Number of actual observations by date: 45.
Source name:
World Development Indicators
Source organization:
World Bank staff estimates based on sources and methods in World Bank's "The Changing Wealth of Nations: Measuring Sustainable Development in the New Millennium" (2011).
Categories, topics:
Economy & Growth, Environment
Last updated:
apr 23, 2017
Indicators value changes by year
Maximum:
20.183
jan 1, 1974
At the date of observation
Value
Absolute change
Change from previous value
jan 1, 1971
18.937
+18.937
0.0%
jan 1, 1972
18.24
-0.697
-3.68%
jan 1, 1973
18.229
-0.011
-0.06%
jan 1, 1974
20.183
+1.954
10.72%
jan 1, 1975
16.263
-3.92
-19.42%
jan 1, 1976
14.561
-1.702
-10.46%
jan 1, 1977
15.465
+0.905
6.21%
jan 1, 1978
14.224
-1.241
-8.03%
jan 1, 1979
12.296
-1.928
-13.56%
jan 1, 1980
11.132
-1.164
-9.47%
jan 1, 1981
10.886
-0.246
-2.21%
jan 1, 1982
10.314
-0.572
-5.25%
jan 1, 1983
9.338
-0.976
-9.46%
jan 1, 1984
9.962
+0.624
6.68%
jan 1, 1985
12.831
+2.869
28.8%
jan 1, 1986
10.971
-1.859
-14.49%
jan 1, 1987
11.199
+0.227
2.07%
jan 1, 1988
10.232
-0.967
-8.63%
jan 1, 1989
11.385
+1.153
11.27%
jan 1, 1990
12.784
+1.399
12.29%
jan 1, 1991
11.49
-1.294
-10.12%
jan 1, 1992
10.875
-0.615
-5.35%
jan 1, 1993
10.011
-0.864
-7.95%
jan 1, 1994
9.906
-0.105
-1.05%
jan 1, 1995
11.235
+1.33
13.42%
jan 1, 1996
12.48
+1.244
11.07%
jan 1, 1997
12.832
+0.352
2.82%
jan 1, 1998
13.501
+0.669
5.21%
jan 1, 1999
12.091
-1.41
-10.44%
jan 1, 2000
13.549
+1.458
12.06%
jan 1, 2001
14.124
+0.574
4.24%
jan 1, 2002
11.995
-2.129
-15.07%
jan 1, 2003
10.54
-1.455
-12.13%
jan 1, 2004
11.105
+0.565
5.36%
jan 1, 2005
12.15
+1.045
9.41%
jan 1, 2006
11.818
-0.332
-2.73%
jan 1, 2007
13.909
+2.091
17.7%
jan 1, 2008
14.359
+0.45
3.23%
jan 1, 2009
11.896
-2.463
-17.15%
jan 1, 2010
10.152
-1.744
-14.66%
jan 1, 2011
11.14
+0.988
9.74%
jan 1, 2012
12.671
+1.531
13.74%
jan 1, 2013
12.462
-0.209
-1.65%
jan 1, 2014
12.154
-0.307
-2.47%
jan 1, 2015
12.237
+0.083
0.68%
Ranking of countries by current statistics by years


Comments: