29
/
en
AIzaSyAYiBZKx7MnpbEhh9jyipgxe19OcubqV5w
April 1, 2024
230634
Rwanda
RWA
true
2
1
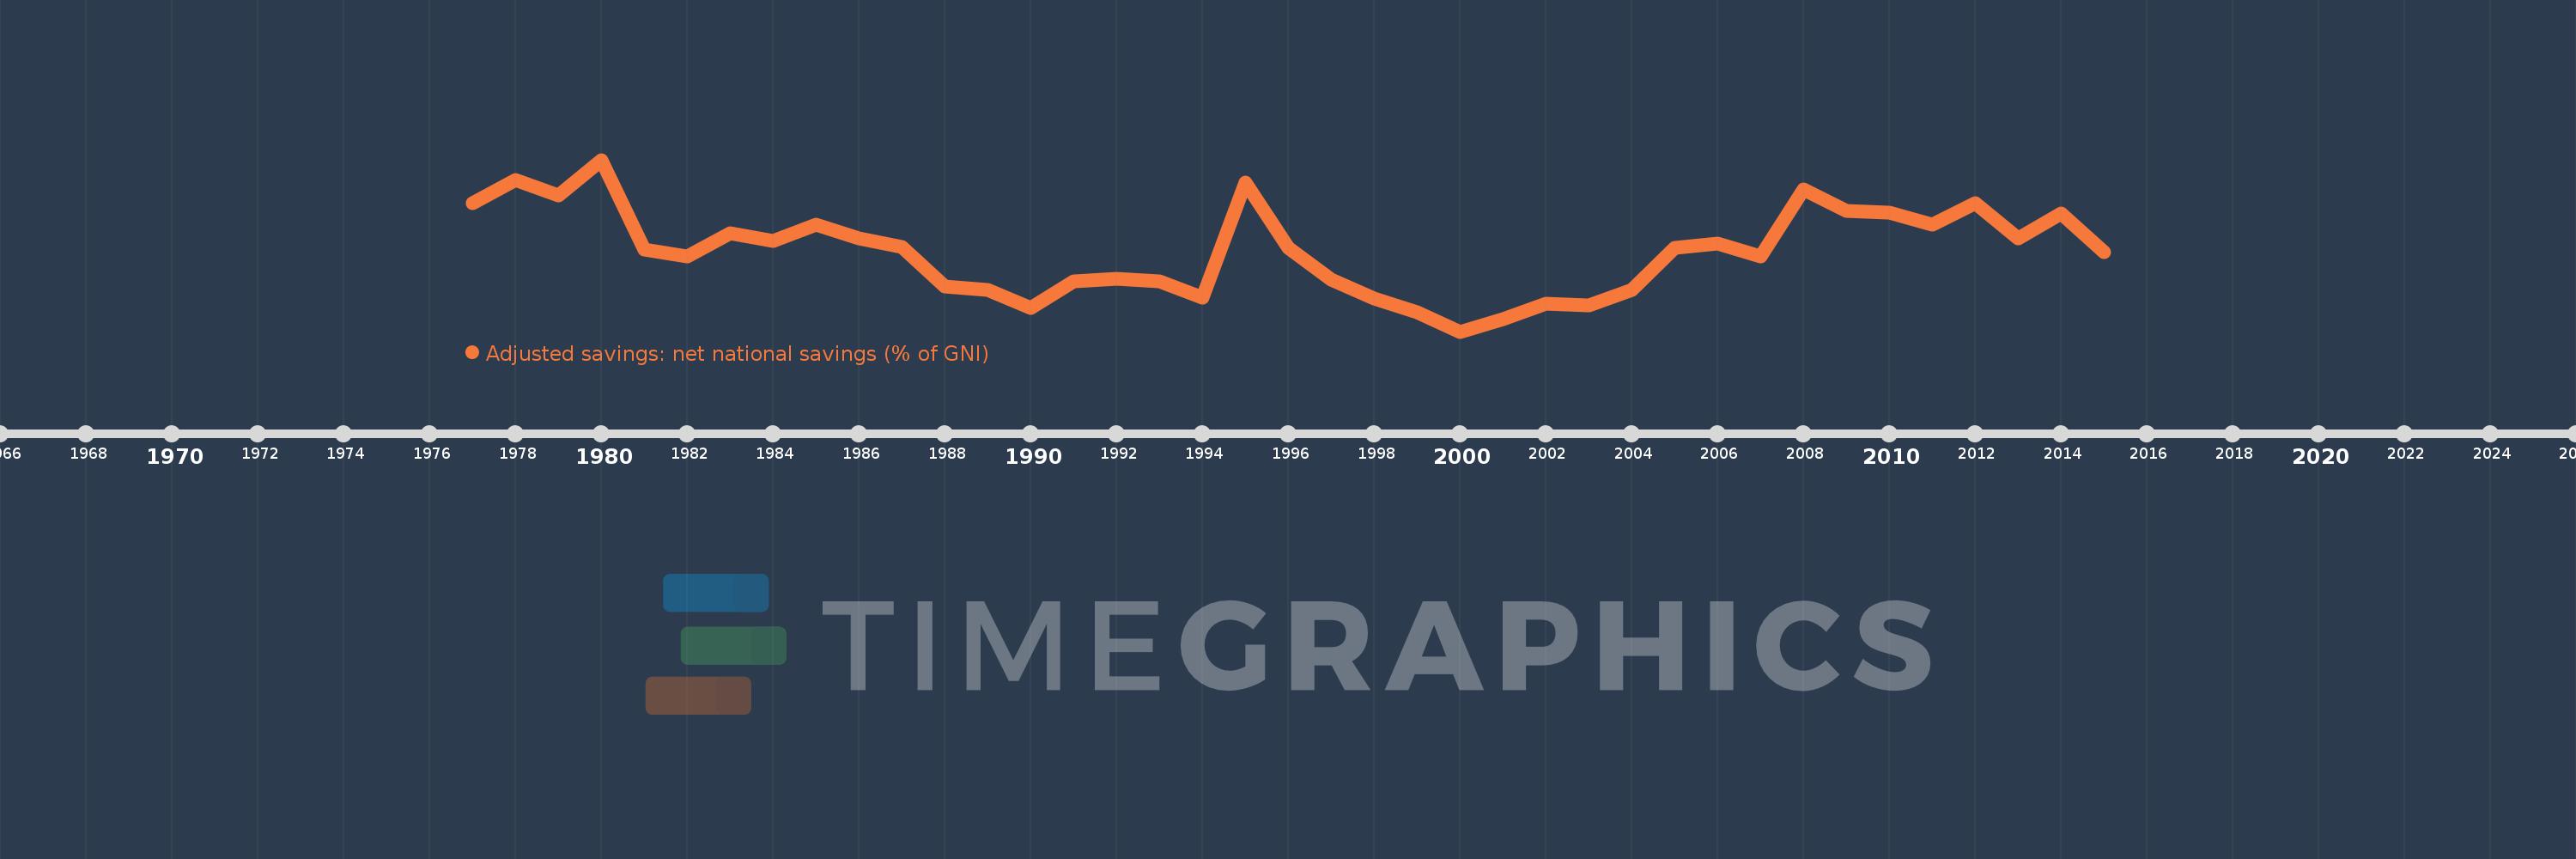
Adjusted savings: net national savings (% of GNI)
2015,2014,2013,2012,2011,2010,2009,2008,2007,2006,2005,2004,2003,2002,2001,2000,1999,1998,1997,1996,1995,1994,1993,1992,1991,1990,1989,1988,1987,1986,1985,1984,1983,1982,1981,1980,1979,1978,1977
This statistics in other country:
AfghanistanAlbaniaAlgeriaAngolaAntigua and BarbudaArab WorldArgentinaArmeniaAustraliaAustriaAzerbaijanBahamas, TheBahrainBangladeshBarbadosBelarusBelgiumBelizeBeninBermudaBhutanBoliviaBosnia and HerzegovinaBotswanaBrazilBrunei DarussalamBulgariaBurkina FasoBurundiCabo VerdeCambodiaCameroonCanadaCaribbean small statesCentral African RepublicCentral Europe and the BalticsChadChileChinaColombiaComorosCongo, Dem. Rep.Congo, Rep.Costa RicaCote d'IvoireCroatiaCyprusCzech RepublicDenmarkDjiboutiDominicaDominican RepublicEarly-demographic dividendEast Asia & PacificEast Asia & Pacific (excluding high income)East Asia & Pacific (IDA & IBRD countries)EcuadorEgypt, Arab Rep.El SalvadorEquatorial GuineaEritreaEstoniaEthiopiaEuro areaEurope & Central AsiaEurope & Central Asia (excluding high income)Europe & Central Asia (IDA & IBRD countries)European UnionFijiFinlandFragile and conflict affected situationsFranceGabonGambia, TheGeorgiaGermanyGhanaGreeceGrenadaGuatemalaGuineaGuinea-BissauGuyanaHaitiHeavily indebted poor countries (HIPC)High incomeHondurasHong Kong SAR, ChinaHungaryIBRD onlyIcelandIDA & IBRD totalIDA blendIDA onlyIDA totalIndiaIndonesiaIran, Islamic Rep.IraqIrelandIsraelItalyJamaicaJapanJordanKazakhstanKenyaKiribatiKorea, Rep.KosovoKuwaitKyrgyz RepublicLao PDRLate-demographic dividendLatin America & Caribbean Latin America & Caribbean (excluding high income)Latin America & the Caribbean (IDA & IBRD countries)LatviaLeast developed countries: UN classificationLebanonLesothoLiberiaLibyaLithuaniaLow & middle incomeLow incomeLower middle incomeLuxembourgMacao SAR, ChinaMacedonia, FYRMadagascarMalawiMalaysiaMaldivesMaliMaltaMauritaniaMauritiusMexicoMiddle East & North AfricaMiddle East & North Africa (excluding high income)Middle East & North Africa (IDA & IBRD countries)Middle incomeMoldovaMongoliaMontenegroMoroccoMozambiqueNamibiaNepalNetherlandsNew ZealandNicaraguaNigerNigeriaNorth AmericaNorwayOECD membersOmanOther small statesPacific island small statesPakistanPanamaPapua New GuineaParaguayPeruPhilippinesPolandPortugalPost-demographic dividendPre-demographic dividendQatarRomaniaRussian FederationRwandaSaudi ArabiaSenegalSerbiaSeychellesSierra LeoneSingaporeSlovak RepublicSloveniaSmall statesSolomon IslandsSouth AfricaSouth AsiaSouth Asia (IDA & IBRD)SpainSri LankaSt. Kitts and NevisSt. LuciaSt. Vincent and the GrenadinesSub-Saharan Africa Sub-Saharan Africa (excluding high income)Sub-Saharan Africa (IDA & IBRD countries)SudanSurinameSwazilandSwedenSwitzerlandSyrian Arab RepublicTajikistanTanzaniaThailandTimor-LesteTogoTongaTrinidad and TobagoTunisiaTurkeyTurkmenistanUgandaUkraineUnited KingdomUnited StatesUpper middle incomeUruguayVanuatuVenezuela, RBVietnamWest Bank and GazaWorldYemen, Rep.ZambiaZimbabwe Timeline:
This timeline shows a graph from 1977 to 2015 of Rwanda. No data until 1976. Number of actual observations by date: 39.
Source name:
World Development Indicators
Source organization:
World Bank staff estimates based on sources and methods in World Bank's "The Changing Wealth of Nations: Measuring Sustainable Development in the New Millennium" (2011).
Categories, topics:
Economy & Growth, Environment
Last updated:
apr 23, 2017
Indicators value changes by year
Minimum:
-3.282
jan 1, 2000
Maximum:
19.548
jan 1, 1980
At the date of observation
Value
Absolute change
Change from previous value
jan 1, 1977
13.773
+13.773
0.0%
jan 1, 1978
16.875
+3.102
22.52%
jan 1, 1979
14.816
-2.059
-12.2%
jan 1, 1980
19.548
+4.732
31.94%
jan 1, 1981
7.644
-11.904
-60.9%
jan 1, 1982
6.671
-0.973
-12.73%
jan 1, 1983
9.782
+3.112
46.64%
jan 1, 1984
8.709
-1.074
-10.97%
jan 1, 1985
10.917
+2.208
25.35%
jan 1, 1986
9.159
-1.758
-16.1%
jan 1, 1987
7.947
-1.212
-13.23%
jan 1, 1988
2.686
-5.261
-66.2%
jan 1, 1989
2.242
-0.444
-16.54%
jan 1, 1990
-0.118
-2.359
-105.26%
jan 1, 1991
3.351
+3.469
-2.94K%
jan 1, 1992
3.744
+0.393
11.72%
jan 1, 1993
3.376
-0.367
-9.81%
jan 1, 1994
1.215
-2.161
-64.02%
jan 1, 1995
16.556
+15.341
1.26K%
jan 1, 1996
7.868
-8.688
-52.48%
jan 1, 1997
3.668
-4.2
-53.38%
jan 1, 1998
1.162
-2.505
-68.31%
jan 1, 1999
-0.753
-1.915
-164.76%
jan 1, 2000
-3.282
-2.529
336.02%
jan 1, 2001
-1.658
+1.624
-49.48%
jan 1, 2002
0.377
+2.036
-122.76%
jan 1, 2003
0.178
-0.199
-52.74%
jan 1, 2004
2.222
+2.044
1.15K%
jan 1, 2005
7.89
+5.668
255.09%
jan 1, 2006
8.47
+0.58
7.35%
jan 1, 2007
6.654
-1.816
-21.45%
jan 1, 2008
15.661
+9.007
135.37%
jan 1, 2009
12.757
-2.904
-18.54%
jan 1, 2010
12.49
-0.267
-2.09%
jan 1, 2011
10.908
-1.583
-12.67%
jan 1, 2012
13.833
+2.925
26.81%
jan 1, 2013
9.089
-4.744
-34.29%
jan 1, 2014
12.423
+3.334
36.68%
jan 1, 2015
7.22
-5.203
-41.88%
Ranking of countries by current statistics by years


Comments: