29
/
en
AIzaSyAYiBZKx7MnpbEhh9jyipgxe19OcubqV5w
April 1, 2024
43173
Latin America & the Caribbean (IDA & IBRD countries)
TLA
false
2
1
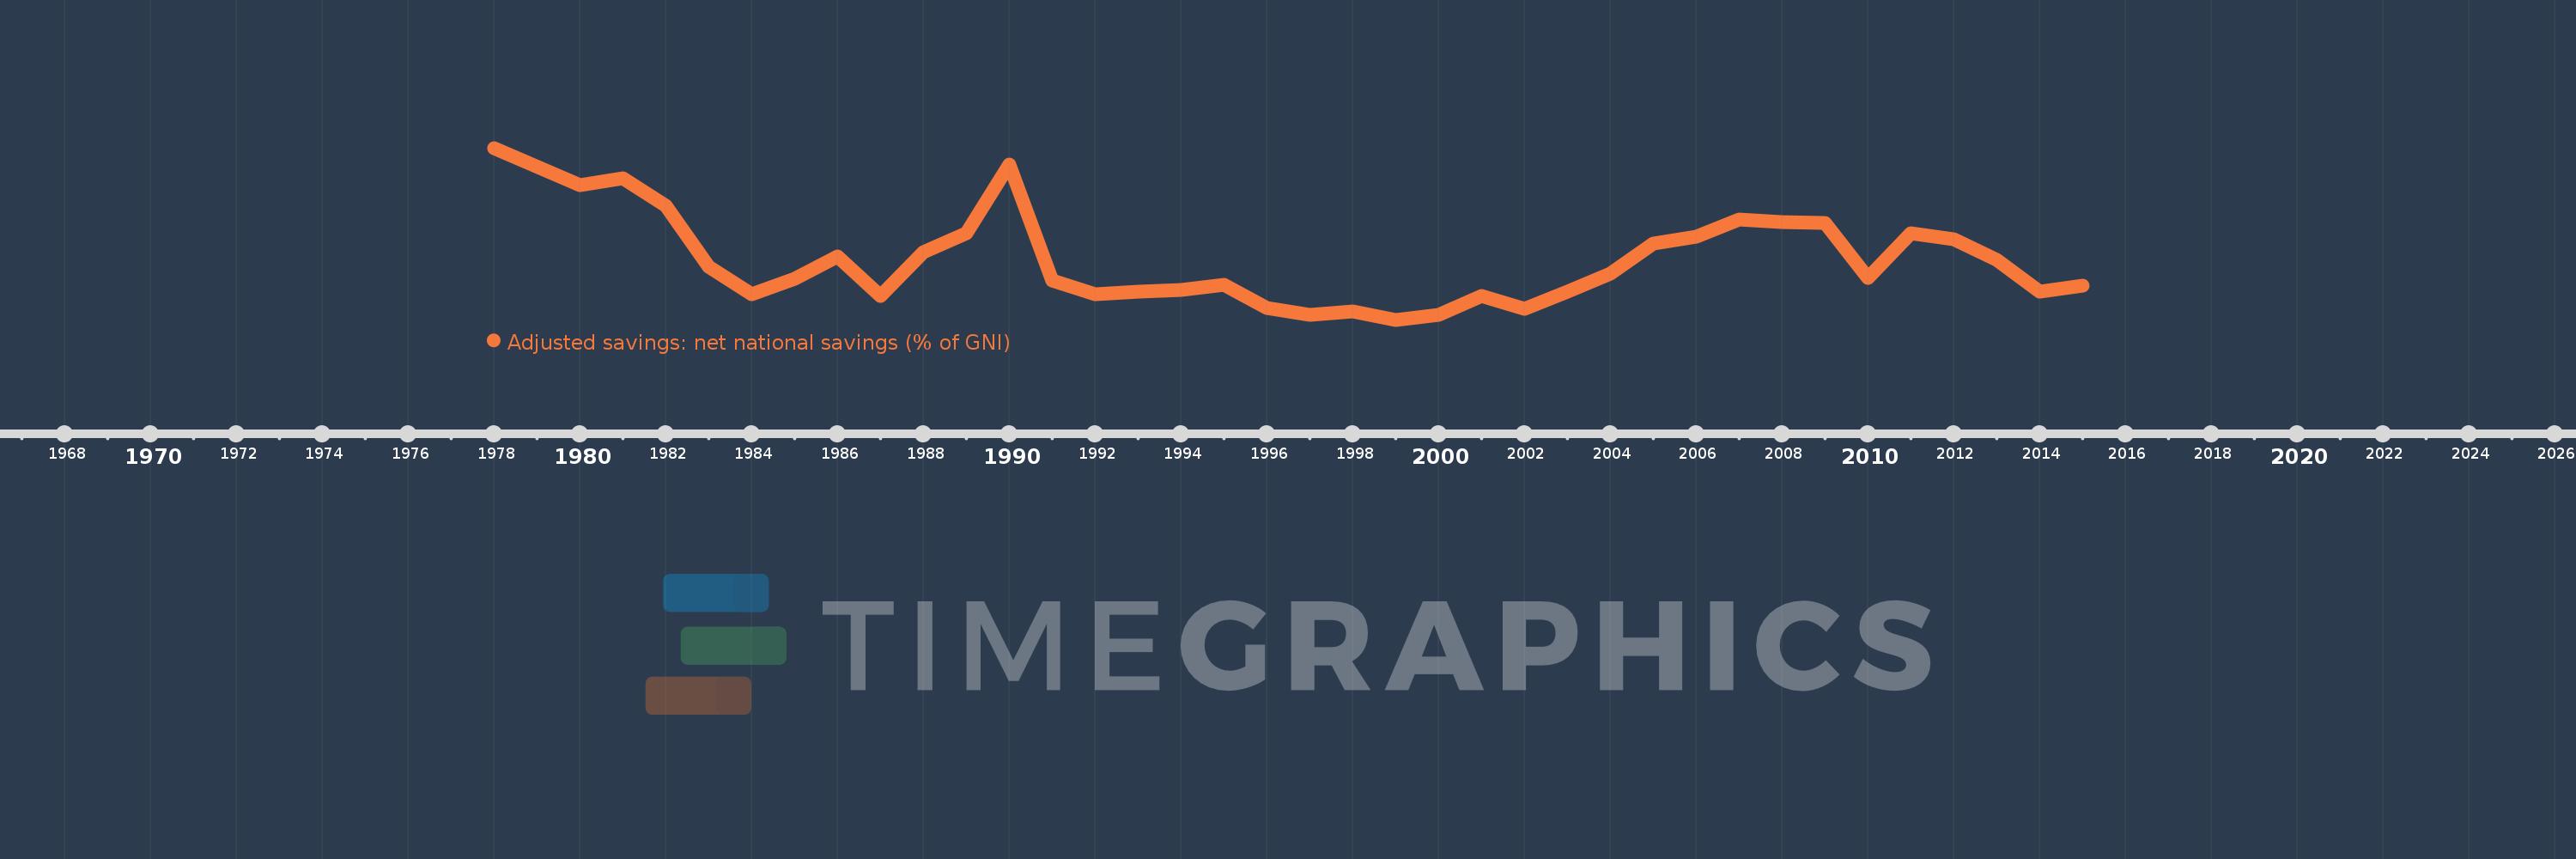
Adjusted savings: net national savings (% of GNI)
2015,2014,2013,2012,2011,2010,2009,2008,2007,2006,2005,2004,2003,2002,2001,2000,1999,1998,1997,1996,1995,1994,1993,1992,1991,1990,1989,1988,1987,1986,1985,1984,1983,1982,1981,1980,1978
This statistics in other country:
AfghanistanAlbaniaAlgeriaAngolaAntigua and BarbudaArab WorldArgentinaArmeniaAustraliaAustriaAzerbaijanBahamas, TheBahrainBangladeshBarbadosBelarusBelgiumBelizeBeninBermudaBhutanBoliviaBosnia and HerzegovinaBotswanaBrazilBrunei DarussalamBulgariaBurkina FasoBurundiCabo VerdeCambodiaCameroonCanadaCaribbean small statesCentral African RepublicCentral Europe and the BalticsChadChileChinaColombiaComorosCongo, Dem. Rep.Congo, Rep.Costa RicaCote d'IvoireCroatiaCyprusCzech RepublicDenmarkDjiboutiDominicaDominican RepublicEarly-demographic dividendEast Asia & PacificEast Asia & Pacific (excluding high income)East Asia & Pacific (IDA & IBRD countries)EcuadorEgypt, Arab Rep.El SalvadorEquatorial GuineaEritreaEstoniaEthiopiaEuro areaEurope & Central AsiaEurope & Central Asia (excluding high income)Europe & Central Asia (IDA & IBRD countries)European UnionFijiFinlandFragile and conflict affected situationsFranceGabonGambia, TheGeorgiaGermanyGhanaGreeceGrenadaGuatemalaGuineaGuinea-BissauGuyanaHaitiHeavily indebted poor countries (HIPC)High incomeHondurasHong Kong SAR, ChinaHungaryIBRD onlyIcelandIDA & IBRD totalIDA blendIDA onlyIDA totalIndiaIndonesiaIran, Islamic Rep.IraqIrelandIsraelItalyJamaicaJapanJordanKazakhstanKenyaKiribatiKorea, Rep.KosovoKuwaitKyrgyz RepublicLao PDRLate-demographic dividendLatin America & Caribbean Latin America & Caribbean (excluding high income)Latin America & the Caribbean (IDA & IBRD countries)LatviaLeast developed countries: UN classificationLebanonLesothoLiberiaLibyaLithuaniaLow & middle incomeLow incomeLower middle incomeLuxembourgMacao SAR, ChinaMacedonia, FYRMadagascarMalawiMalaysiaMaldivesMaliMaltaMauritaniaMauritiusMexicoMiddle East & North AfricaMiddle East & North Africa (excluding high income)Middle East & North Africa (IDA & IBRD countries)Middle incomeMoldovaMongoliaMontenegroMoroccoMozambiqueNamibiaNepalNetherlandsNew ZealandNicaraguaNigerNigeriaNorth AmericaNorwayOECD membersOmanOther small statesPacific island small statesPakistanPanamaPapua New GuineaParaguayPeruPhilippinesPolandPortugalPost-demographic dividendPre-demographic dividendQatarRomaniaRussian FederationRwandaSaudi ArabiaSenegalSerbiaSeychellesSierra LeoneSingaporeSlovak RepublicSloveniaSmall statesSolomon IslandsSouth AfricaSouth AsiaSouth Asia (IDA & IBRD)SpainSri LankaSt. Kitts and NevisSt. LuciaSt. Vincent and the GrenadinesSub-Saharan Africa Sub-Saharan Africa (excluding high income)Sub-Saharan Africa (IDA & IBRD countries)SudanSurinameSwazilandSwedenSwitzerlandSyrian Arab RepublicTajikistanTanzaniaThailandTimor-LesteTogoTongaTrinidad and TobagoTunisiaTurkeyTurkmenistanUgandaUkraineUnited KingdomUnited StatesUpper middle incomeUruguayVanuatuVenezuela, RBVietnamWest Bank and GazaWorldYemen, Rep.ZambiaZimbabwe Timeline:
This timeline shows a graph from 1978 to 2015 of Latin America & the Caribbean (IDA & IBRD countries). No data until 1977. Number of actual observations by date: 37.
Source name:
World Development Indicators
Source organization:
World Bank staff estimates based on sources and methods in World Bank's "The Changing Wealth of Nations: Measuring Sustainable Development in the New Millennium" (2011).
Categories, topics:
Economy & Growth, Environment
Last updated:
apr 23, 2017
Indicators value changes by year
Maximum:
17.178
jan 1, 1978
At the date of observation
Value
Absolute change
Change from previous value
jan 1, 1978
17.178
+17.178
0.0%
jan 1, 1980
14.48
-2.698
-15.7%
jan 1, 1981
14.959
+0.479
3.31%
jan 1, 1982
12.965
-1.994
-13.33%
jan 1, 1983
8.526
-4.439
-34.24%
jan 1, 1984
6.554
-1.972
-23.13%
jan 1, 1985
7.677
+1.122
17.13%
jan 1, 1986
9.293
+1.616
21.06%
jan 1, 1987
6.403
-2.891
-31.1%
jan 1, 1988
9.6
+3.198
49.94%
jan 1, 1989
10.958
+1.358
14.14%
jan 1, 1990
15.943
+4.985
45.5%
jan 1, 1991
7.571
-8.372
-52.51%
jan 1, 1992
6.535
-1.036
-13.68%
jan 1, 1993
6.733
+0.198
3.03%
jan 1, 1994
6.87
+0.137
2.03%
jan 1, 1995
7.233
+0.363
5.28%
jan 1, 1996
5.545
-1.688
-23.34%
jan 1, 1997
5.035
-0.51
-9.2%
jan 1, 1998
5.279
+0.244
4.84%
jan 1, 1999
4.702
-0.577
-10.93%
jan 1, 2000
5.062
+0.36
7.66%
jan 1, 2001
6.437
+1.375
27.16%
jan 1, 2002
5.517
-0.92
-14.29%
jan 1, 2003
6.751
+1.235
22.38%
jan 1, 2004
8.059
+1.308
19.37%
jan 1, 2005
10.258
+2.199
27.29%
jan 1, 2006
10.737
+0.479
4.67%
jan 1, 2007
11.993
+1.255
11.69%
jan 1, 2008
11.784
-0.209
-1.74%
jan 1, 2009
11.746
-0.038
-0.32%
jan 1, 2010
7.744
-4.002
-34.07%
jan 1, 2011
10.955
+3.211
41.46%
jan 1, 2012
10.552
-0.402
-3.67%
jan 1, 2013
9.042
-1.51
-14.31%
jan 1, 2014
6.763
-2.279
-25.2%
jan 1, 2015
7.198
+0.435
6.43%
Ranking of countries by current statistics by years


Comments: