29
/
en
AIzaSyAYiBZKx7MnpbEhh9jyipgxe19OcubqV5w
April 1, 2024
53914
Pacific island small states
PSS
false
2
1
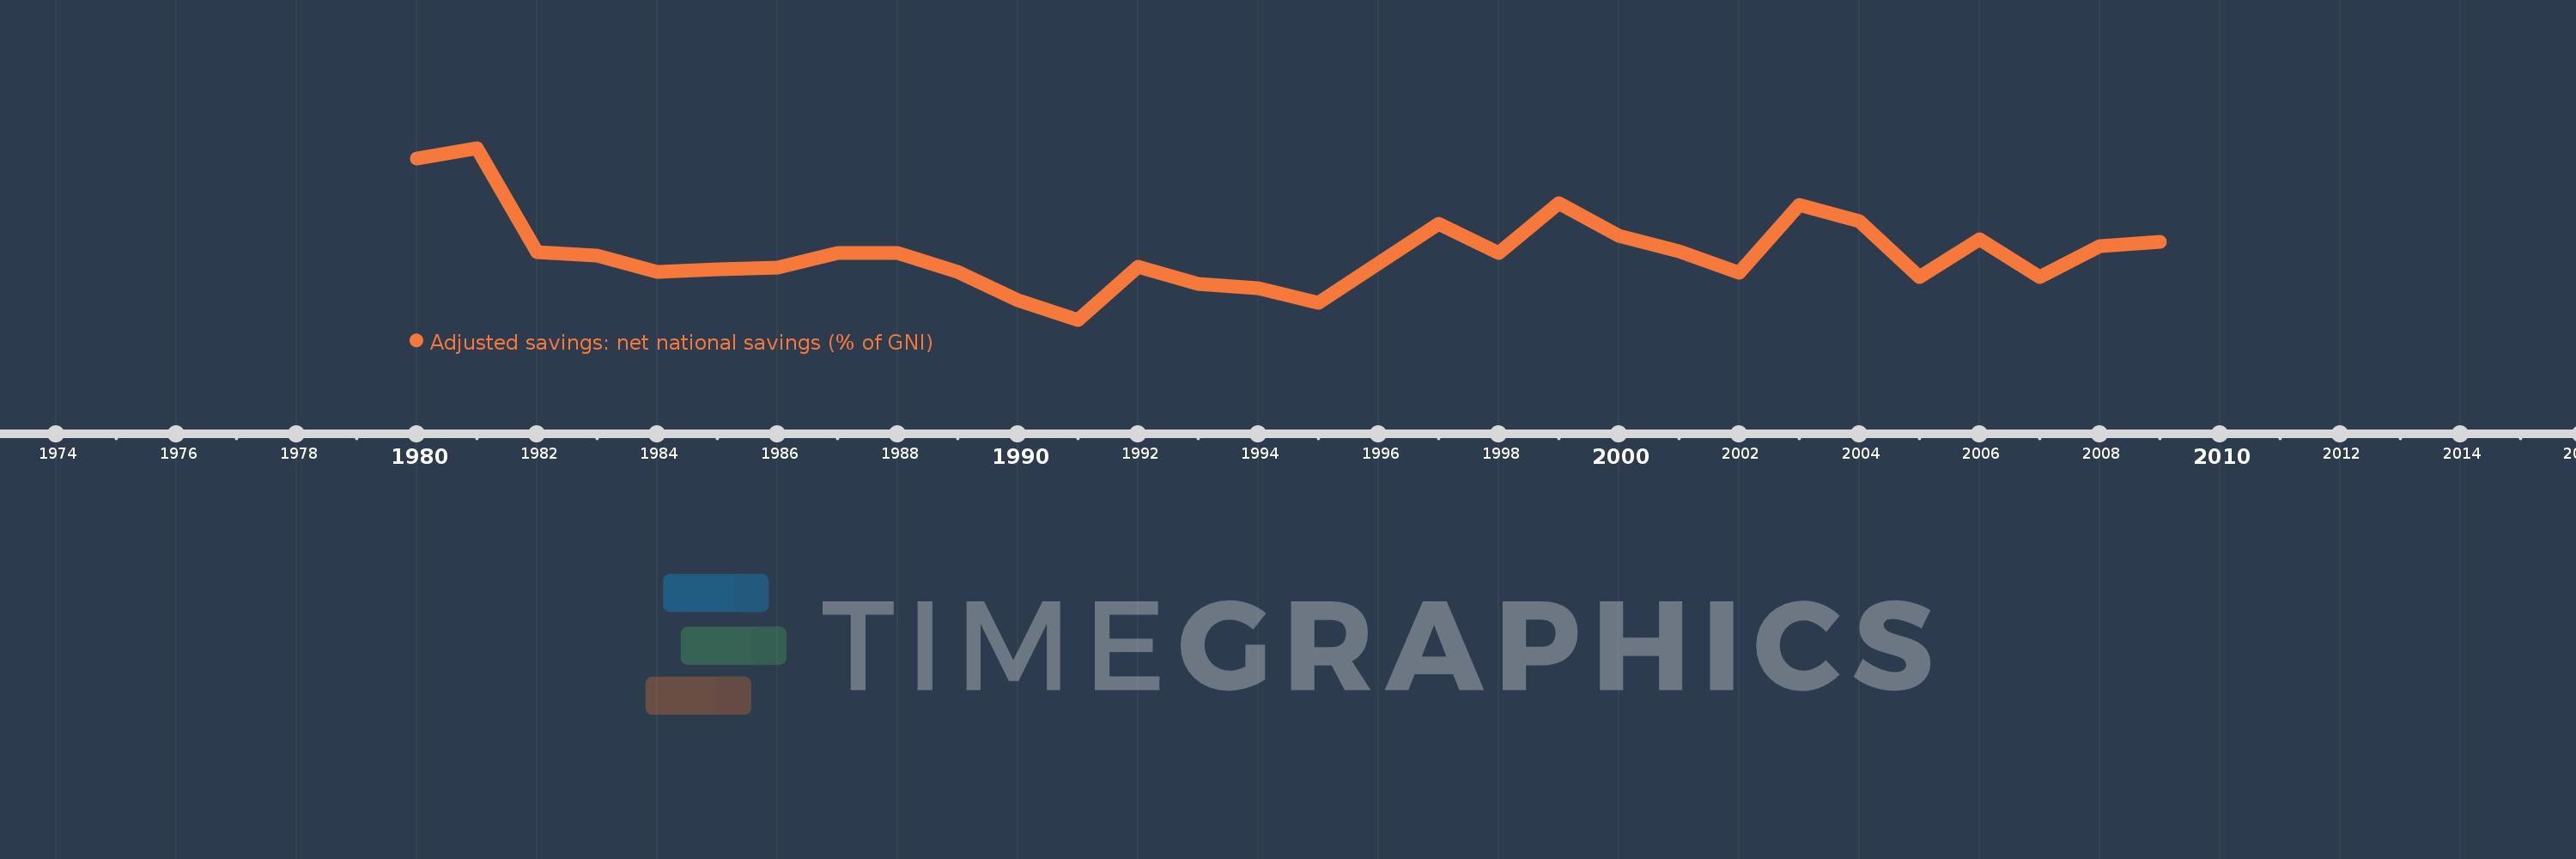
Adjusted savings: net national savings (% of GNI)
2009,2008,2007,2006,2005,2004,2003,2002,2001,2000,1999,1998,1997,1995,1994,1993,1992,1991,1990,1989,1988,1987,1986,1985,1984,1983,1982,1981,1980
This statistics in other country:
AfghanistanAlbaniaAlgeriaAngolaAntigua and BarbudaArab WorldArgentinaArmeniaAustraliaAustriaAzerbaijanBahamas, TheBahrainBangladeshBarbadosBelarusBelgiumBelizeBeninBermudaBhutanBoliviaBosnia and HerzegovinaBotswanaBrazilBrunei DarussalamBulgariaBurkina FasoBurundiCabo VerdeCambodiaCameroonCanadaCaribbean small statesCentral African RepublicCentral Europe and the BalticsChadChileChinaColombiaComorosCongo, Dem. Rep.Congo, Rep.Costa RicaCote d'IvoireCroatiaCyprusCzech RepublicDenmarkDjiboutiDominicaDominican RepublicEarly-demographic dividendEast Asia & PacificEast Asia & Pacific (excluding high income)East Asia & Pacific (IDA & IBRD countries)EcuadorEgypt, Arab Rep.El SalvadorEquatorial GuineaEritreaEstoniaEthiopiaEuro areaEurope & Central AsiaEurope & Central Asia (excluding high income)Europe & Central Asia (IDA & IBRD countries)European UnionFijiFinlandFragile and conflict affected situationsFranceGabonGambia, TheGeorgiaGermanyGhanaGreeceGrenadaGuatemalaGuineaGuinea-BissauGuyanaHaitiHeavily indebted poor countries (HIPC)High incomeHondurasHong Kong SAR, ChinaHungaryIBRD onlyIcelandIDA & IBRD totalIDA blendIDA onlyIDA totalIndiaIndonesiaIran, Islamic Rep.IraqIrelandIsraelItalyJamaicaJapanJordanKazakhstanKenyaKiribatiKorea, Rep.KosovoKuwaitKyrgyz RepublicLao PDRLate-demographic dividendLatin America & Caribbean Latin America & Caribbean (excluding high income)Latin America & the Caribbean (IDA & IBRD countries)LatviaLeast developed countries: UN classificationLebanonLesothoLiberiaLibyaLithuaniaLow & middle incomeLow incomeLower middle incomeLuxembourgMacao SAR, ChinaMacedonia, FYRMadagascarMalawiMalaysiaMaldivesMaliMaltaMauritaniaMauritiusMexicoMiddle East & North AfricaMiddle East & North Africa (excluding high income)Middle East & North Africa (IDA & IBRD countries)Middle incomeMoldovaMongoliaMontenegroMoroccoMozambiqueNamibiaNepalNetherlandsNew ZealandNicaraguaNigerNigeriaNorth AmericaNorwayOECD membersOmanOther small statesPacific island small statesPakistanPanamaPapua New GuineaParaguayPeruPhilippinesPolandPortugalPost-demographic dividendPre-demographic dividendQatarRomaniaRussian FederationRwandaSaudi ArabiaSenegalSerbiaSeychellesSierra LeoneSingaporeSlovak RepublicSloveniaSmall statesSolomon IslandsSouth AfricaSouth AsiaSouth Asia (IDA & IBRD)SpainSri LankaSt. Kitts and NevisSt. LuciaSt. Vincent and the GrenadinesSub-Saharan Africa Sub-Saharan Africa (excluding high income)Sub-Saharan Africa (IDA & IBRD countries)SudanSurinameSwazilandSwedenSwitzerlandSyrian Arab RepublicTajikistanTanzaniaThailandTimor-LesteTogoTongaTrinidad and TobagoTunisiaTurkeyTurkmenistanUgandaUkraineUnited KingdomUnited StatesUpper middle incomeUruguayVanuatuVenezuela, RBVietnamWest Bank and GazaWorldYemen, Rep.ZambiaZimbabwe Timeline:
This timeline shows a graph from 1980 to 2009 of Pacific island small states. No data until 1979. Number of actual observations by date: 29.
Source name:
World Development Indicators
Source organization:
World Bank staff estimates based on sources and methods in World Bank's "The Changing Wealth of Nations: Measuring Sustainable Development in the New Millennium" (2011).
Categories, topics:
Economy & Growth, Environment
Last updated:
apr 23, 2017
Indicators value changes by year
Minimum:
-6.721
jan 1, 1991
Maximum:
18.786
jan 1, 1981
At the date of observation
Value
Absolute change
Change from previous value
jan 1, 1980
17.27
+17.27
0.0%
jan 1, 1981
18.786
+1.515
8.77%
jan 1, 1982
3.254
-15.532
-82.68%
jan 1, 1983
2.775
-0.479
-14.72%
jan 1, 1984
0.361
-2.414
-86.98%
jan 1, 1985
0.753
+0.392
108.54%
jan 1, 1986
0.991
+0.238
31.53%
jan 1, 1987
3.23
+2.239
225.96%
jan 1, 1988
3.191
-0.039
-1.22%
jan 1, 1989
0.349
-2.842
-89.06%
jan 1, 1990
-3.779
-4.128
-1.18K%
jan 1, 1991
-6.721
-2.942
77.85%
jan 1, 1992
1.087
+7.808
-116.17%
jan 1, 1993
-1.376
-2.463
-226.62%
jan 1, 1994
-2.047
-0.671
48.76%
jan 1, 1995
-4.253
-2.206
107.75%
jan 1, 1997
7.552
+11.805
-277.56%
jan 1, 1998
3.126
-4.426
-58.61%
jan 1, 1999
10.641
+7.515
240.45%
jan 1, 2000
5.774
-4.867
-45.74%
jan 1, 2001
3.401
-2.373
-41.1%
jan 1, 2002
0.216
-3.185
-93.64%
jan 1, 2003
10.35
+10.133
4.69K%
jan 1, 2004
7.861
-2.488
-24.04%
jan 1, 2005
-0.409
-8.271
-105.21%
jan 1, 2006
5.174
+5.583
-1.36K%
jan 1, 2007
-0.436
-5.61
-108.43%
jan 1, 2008
4.236
+4.672
-1.07K%
jan 1, 2009
4.874
+0.639
15.08%
Ranking of countries by current statistics by years


Comments: