29
/
en
AIzaSyAYiBZKx7MnpbEhh9jyipgxe19OcubqV5w
April 1, 2024
261834
Thailand
THA
true
2
1
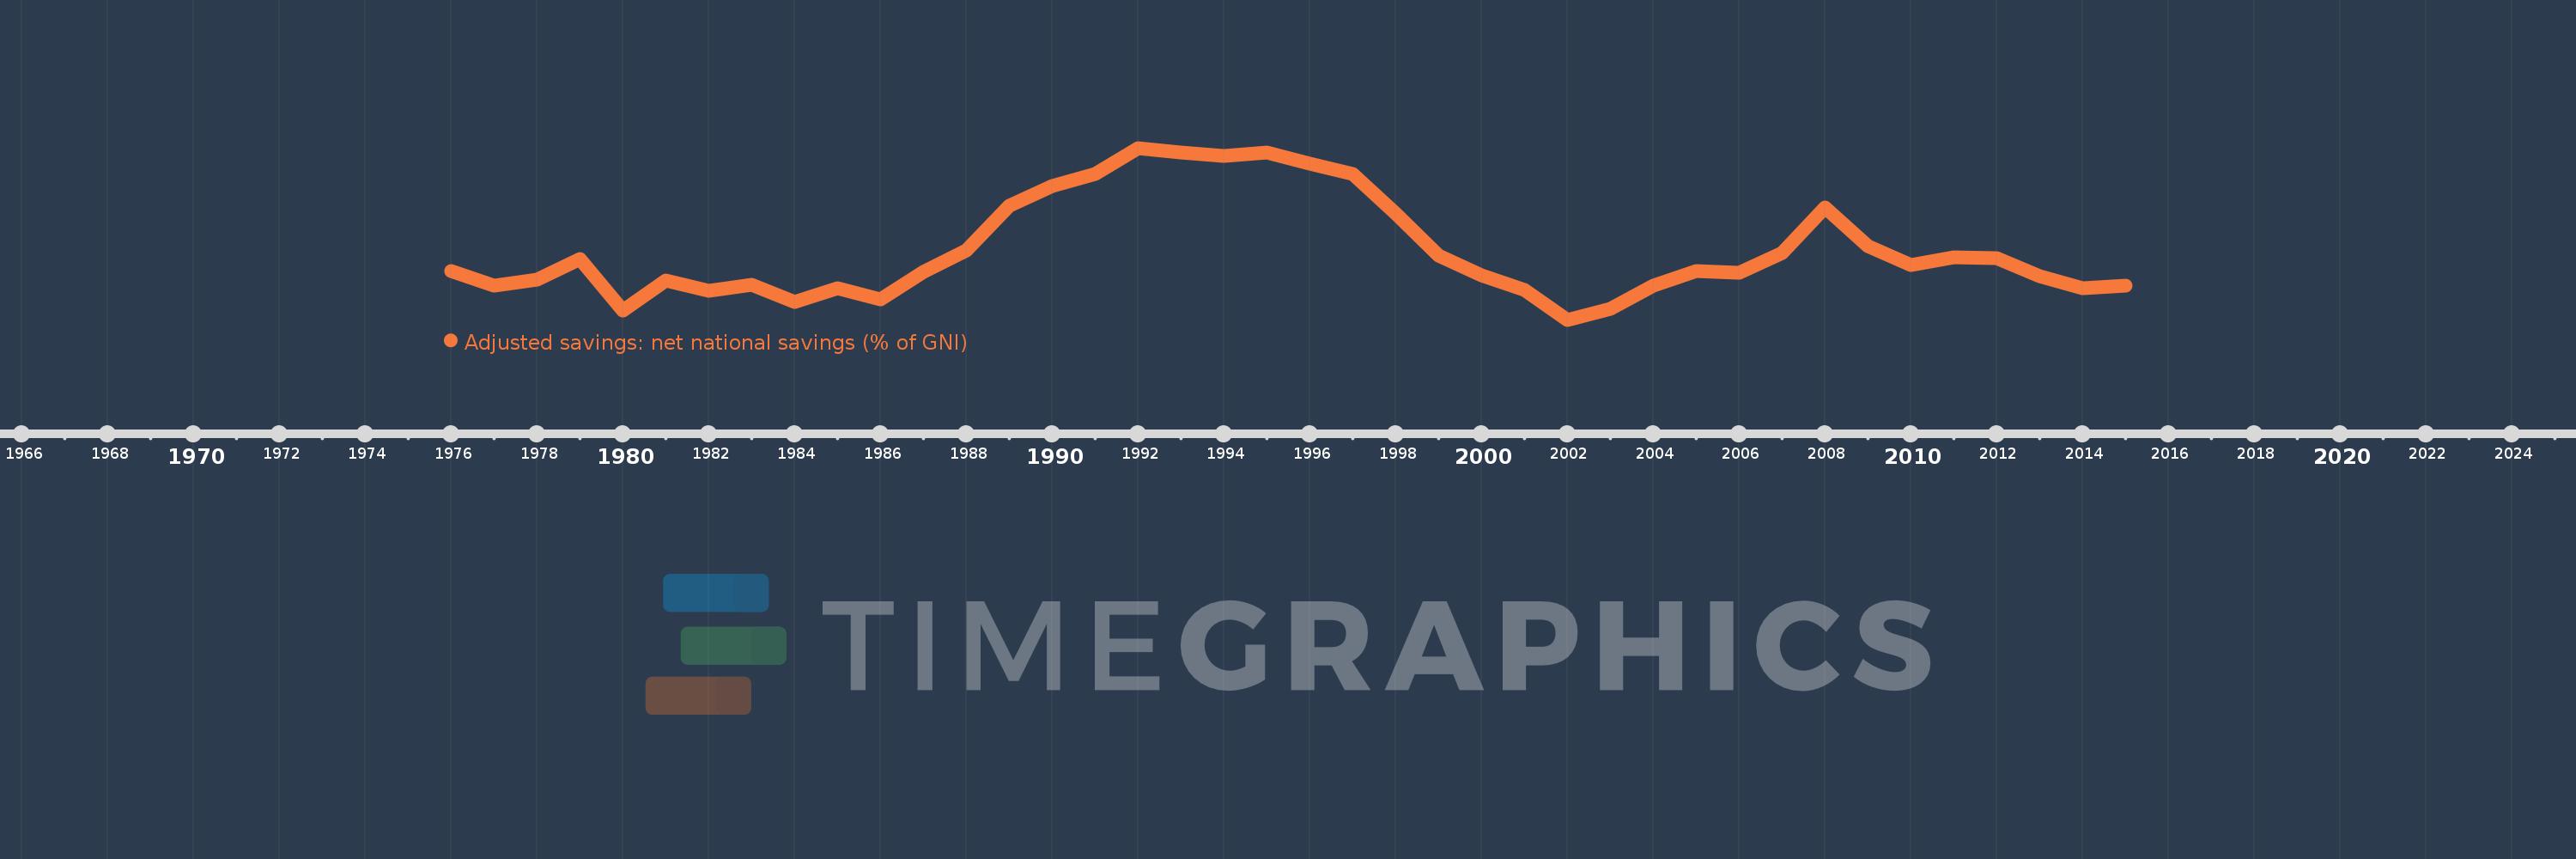
Adjusted savings: net national savings (% of GNI)
2015,2014,2013,2012,2011,2010,2009,2008,2007,2006,2005,2004,2003,2002,2001,2000,1999,1998,1997,1996,1995,1994,1993,1992,1991,1990,1989,1988,1987,1986,1985,1984,1983,1982,1981,1980,1979,1978,1977,1976
This statistics in other country:
AfghanistanAlbaniaAlgeriaAngolaAntigua and BarbudaArab WorldArgentinaArmeniaAustraliaAustriaAzerbaijanBahamas, TheBahrainBangladeshBarbadosBelarusBelgiumBelizeBeninBermudaBhutanBoliviaBosnia and HerzegovinaBotswanaBrazilBrunei DarussalamBulgariaBurkina FasoBurundiCabo VerdeCambodiaCameroonCanadaCaribbean small statesCentral African RepublicCentral Europe and the BalticsChadChileChinaColombiaComorosCongo, Dem. Rep.Congo, Rep.Costa RicaCote d'IvoireCroatiaCyprusCzech RepublicDenmarkDjiboutiDominicaDominican RepublicEarly-demographic dividendEast Asia & PacificEast Asia & Pacific (excluding high income)East Asia & Pacific (IDA & IBRD countries)EcuadorEgypt, Arab Rep.El SalvadorEquatorial GuineaEritreaEstoniaEthiopiaEuro areaEurope & Central AsiaEurope & Central Asia (excluding high income)Europe & Central Asia (IDA & IBRD countries)European UnionFijiFinlandFragile and conflict affected situationsFranceGabonGambia, TheGeorgiaGermanyGhanaGreeceGrenadaGuatemalaGuineaGuinea-BissauGuyanaHaitiHeavily indebted poor countries (HIPC)High incomeHondurasHong Kong SAR, ChinaHungaryIBRD onlyIcelandIDA & IBRD totalIDA blendIDA onlyIDA totalIndiaIndonesiaIran, Islamic Rep.IraqIrelandIsraelItalyJamaicaJapanJordanKazakhstanKenyaKiribatiKorea, Rep.KosovoKuwaitKyrgyz RepublicLao PDRLate-demographic dividendLatin America & Caribbean Latin America & Caribbean (excluding high income)Latin America & the Caribbean (IDA & IBRD countries)LatviaLeast developed countries: UN classificationLebanonLesothoLiberiaLibyaLithuaniaLow & middle incomeLow incomeLower middle incomeLuxembourgMacao SAR, ChinaMacedonia, FYRMadagascarMalawiMalaysiaMaldivesMaliMaltaMauritaniaMauritiusMexicoMiddle East & North AfricaMiddle East & North Africa (excluding high income)Middle East & North Africa (IDA & IBRD countries)Middle incomeMoldovaMongoliaMontenegroMoroccoMozambiqueNamibiaNepalNetherlandsNew ZealandNicaraguaNigerNigeriaNorth AmericaNorwayOECD membersOmanOther small statesPacific island small statesPakistanPanamaPapua New GuineaParaguayPeruPhilippinesPolandPortugalPost-demographic dividendPre-demographic dividendQatarRomaniaRussian FederationRwandaSaudi ArabiaSenegalSerbiaSeychellesSierra LeoneSingaporeSlovak RepublicSloveniaSmall statesSolomon IslandsSouth AfricaSouth AsiaSouth Asia (IDA & IBRD)SpainSri LankaSt. Kitts and NevisSt. LuciaSt. Vincent and the GrenadinesSub-Saharan Africa Sub-Saharan Africa (excluding high income)Sub-Saharan Africa (IDA & IBRD countries)SudanSurinameSwazilandSwedenSwitzerlandSyrian Arab RepublicTajikistanTanzaniaThailandTimor-LesteTogoTongaTrinidad and TobagoTunisiaTurkeyTurkmenistanUgandaUkraineUnited KingdomUnited StatesUpper middle incomeUruguayVanuatuVenezuela, RBVietnamWest Bank and GazaWorldYemen, Rep.ZambiaZimbabwe Timeline:
This timeline shows a graph from 1976 to 2015 of Thailand. No data until 1975. Number of actual observations by date: 40.
Source name:
World Development Indicators
Source organization:
World Bank staff estimates based on sources and methods in World Bank's "The Changing Wealth of Nations: Measuring Sustainable Development in the New Millennium" (2011).
Categories, topics:
Economy & Growth, Environment
Last updated:
apr 23, 2017
Indicators value changes by year
Maximum:
23.697
jan 1, 1992
At the date of observation
Value
Absolute change
Change from previous value
jan 1, 1976
13.021
+13.021
0.0%
jan 1, 1977
11.751
-1.27
-9.75%
jan 1, 1978
12.264
+0.512
4.36%
jan 1, 1979
14.08
+1.817
14.81%
jan 1, 1980
9.584
-4.496
-31.93%
jan 1, 1981
12.189
+2.605
27.18%
jan 1, 1982
11.271
-0.918
-7.53%
jan 1, 1983
11.798
+0.527
4.68%
jan 1, 1984
10.343
-1.455
-12.34%
jan 1, 1985
11.531
+1.188
11.48%
jan 1, 1986
10.568
-0.962
-8.34%
jan 1, 1987
12.964
+2.396
22.67%
jan 1, 1988
14.82
+1.856
14.32%
jan 1, 1989
18.65
+3.83
25.84%
jan 1, 1990
20.386
+1.736
9.31%
jan 1, 1991
21.461
+1.075
5.27%
jan 1, 1992
23.697
+2.236
10.42%
jan 1, 1993
23.292
-0.406
-1.71%
jan 1, 1994
22.991
-0.3
-1.29%
jan 1, 1995
23.316
+0.325
1.41%
jan 1, 1996
22.32
-0.996
-4.27%
jan 1, 1997
21.449
-0.871
-3.9%
jan 1, 1998
17.998
-3.451
-16.09%
jan 1, 1999
14.322
-3.676
-20.42%
jan 1, 2000
12.622
-1.701
-11.87%
jan 1, 2001
11.398
-1.224
-9.7%
jan 1, 2002
8.776
-2.621
-23.0%
jan 1, 2003
9.721
+0.945
10.77%
jan 1, 2004
11.733
+2.012
20.7%
jan 1, 2005
12.989
+1.257
10.71%
jan 1, 2006
12.834
-0.156
-1.2%
jan 1, 2007
14.572
+1.739
13.55%
jan 1, 2008
18.546
+3.973
27.27%
jan 1, 2009
15.137
-3.409
-18.38%
jan 1, 2010
13.497
-1.64
-10.83%
jan 1, 2011
14.176
+0.679
5.03%
jan 1, 2012
14.156
-0.02
-0.14%
jan 1, 2013
12.577
-1.578
-11.15%
jan 1, 2014
11.495
-1.082
-8.6%
jan 1, 2015
11.739
+0.244
2.12%
Ranking of countries by current statistics by years


Comments: