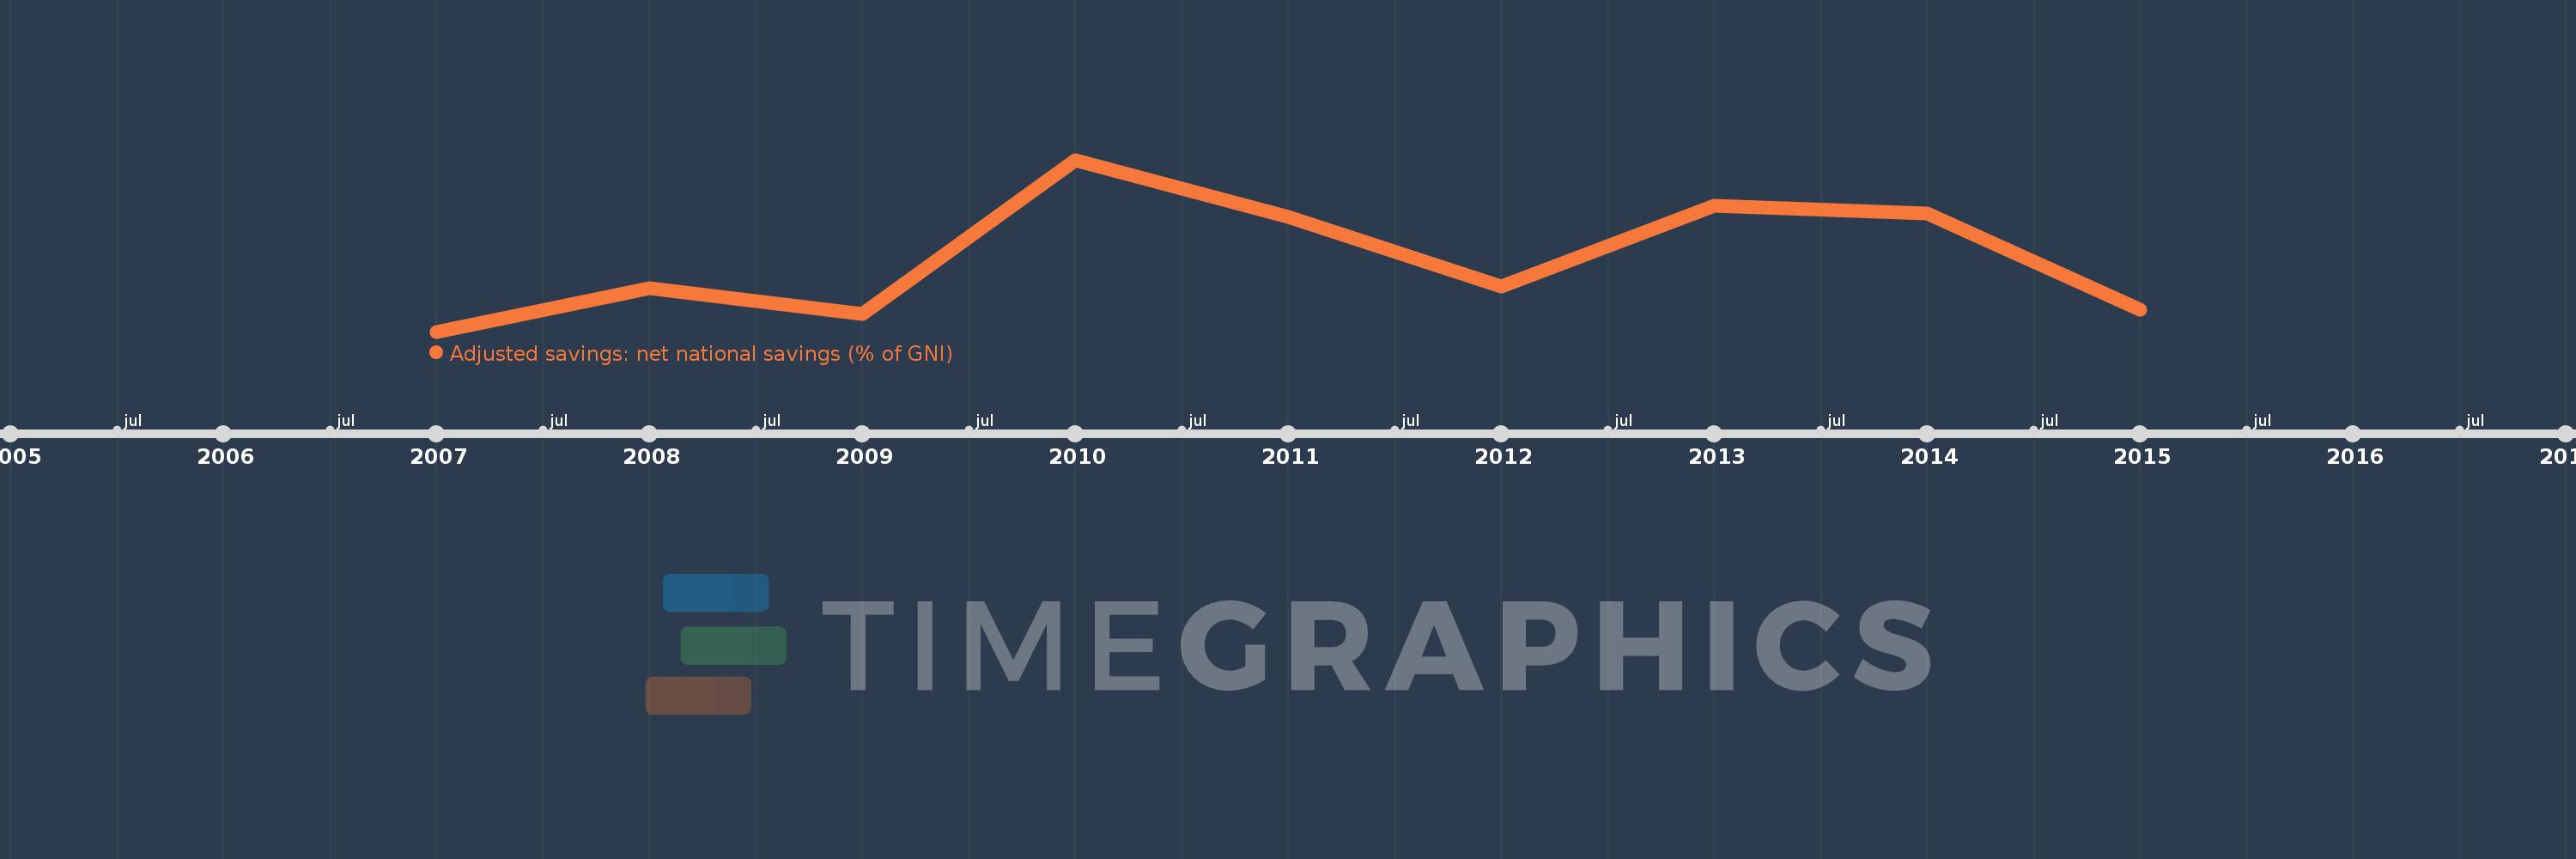
This timeline shows a graph from 2007 to 2015 of Kosovo. No data until 2006. Number of actual observations by date: 9.
Source name:
World Development Indicators
Source organization:
World Bank staff estimates based on sources and methods in World Bank's "The Changing Wealth of Nations: Measuring Sustainable Development in the New Millennium" (2011).
Categories, topics:
Economy & Growth, Environment
Last updated:
apr 23, 2017
Indicators value changes by year
Meaning:
7.817
Minimum:
5.515
jan 1, 2007
Maximum:
10.919
jan 1, 2010
At the date of observation
Value
Absolute change
Change from the previous value
jan 1, 2007
5.515
+5.515
0.0%
jan 1, 2008
6.887
+1.372
24.88%
jan 1, 2009
6.06
-0.827
-12.01%
jan 1, 2010
10.919
+4.859
80.19%
jan 1, 2011
9.121
-1.798
-16.47%
jan 1, 2012
6.935
-2.186
-23.97%
jan 1, 2013
9.485
+2.551
36.78%
jan 1, 2014
9.229
-0.256
-2.7%
jan 1, 2015
6.203
-3.026
-32.78%
Ranking of countries by current statistics by years
