30
/
AIzaSyAYiBZKx7MnpbEhh9jyipgxe19OcubqV5w
April 1, 2024
53193
Other small states
OSS
false
2
1
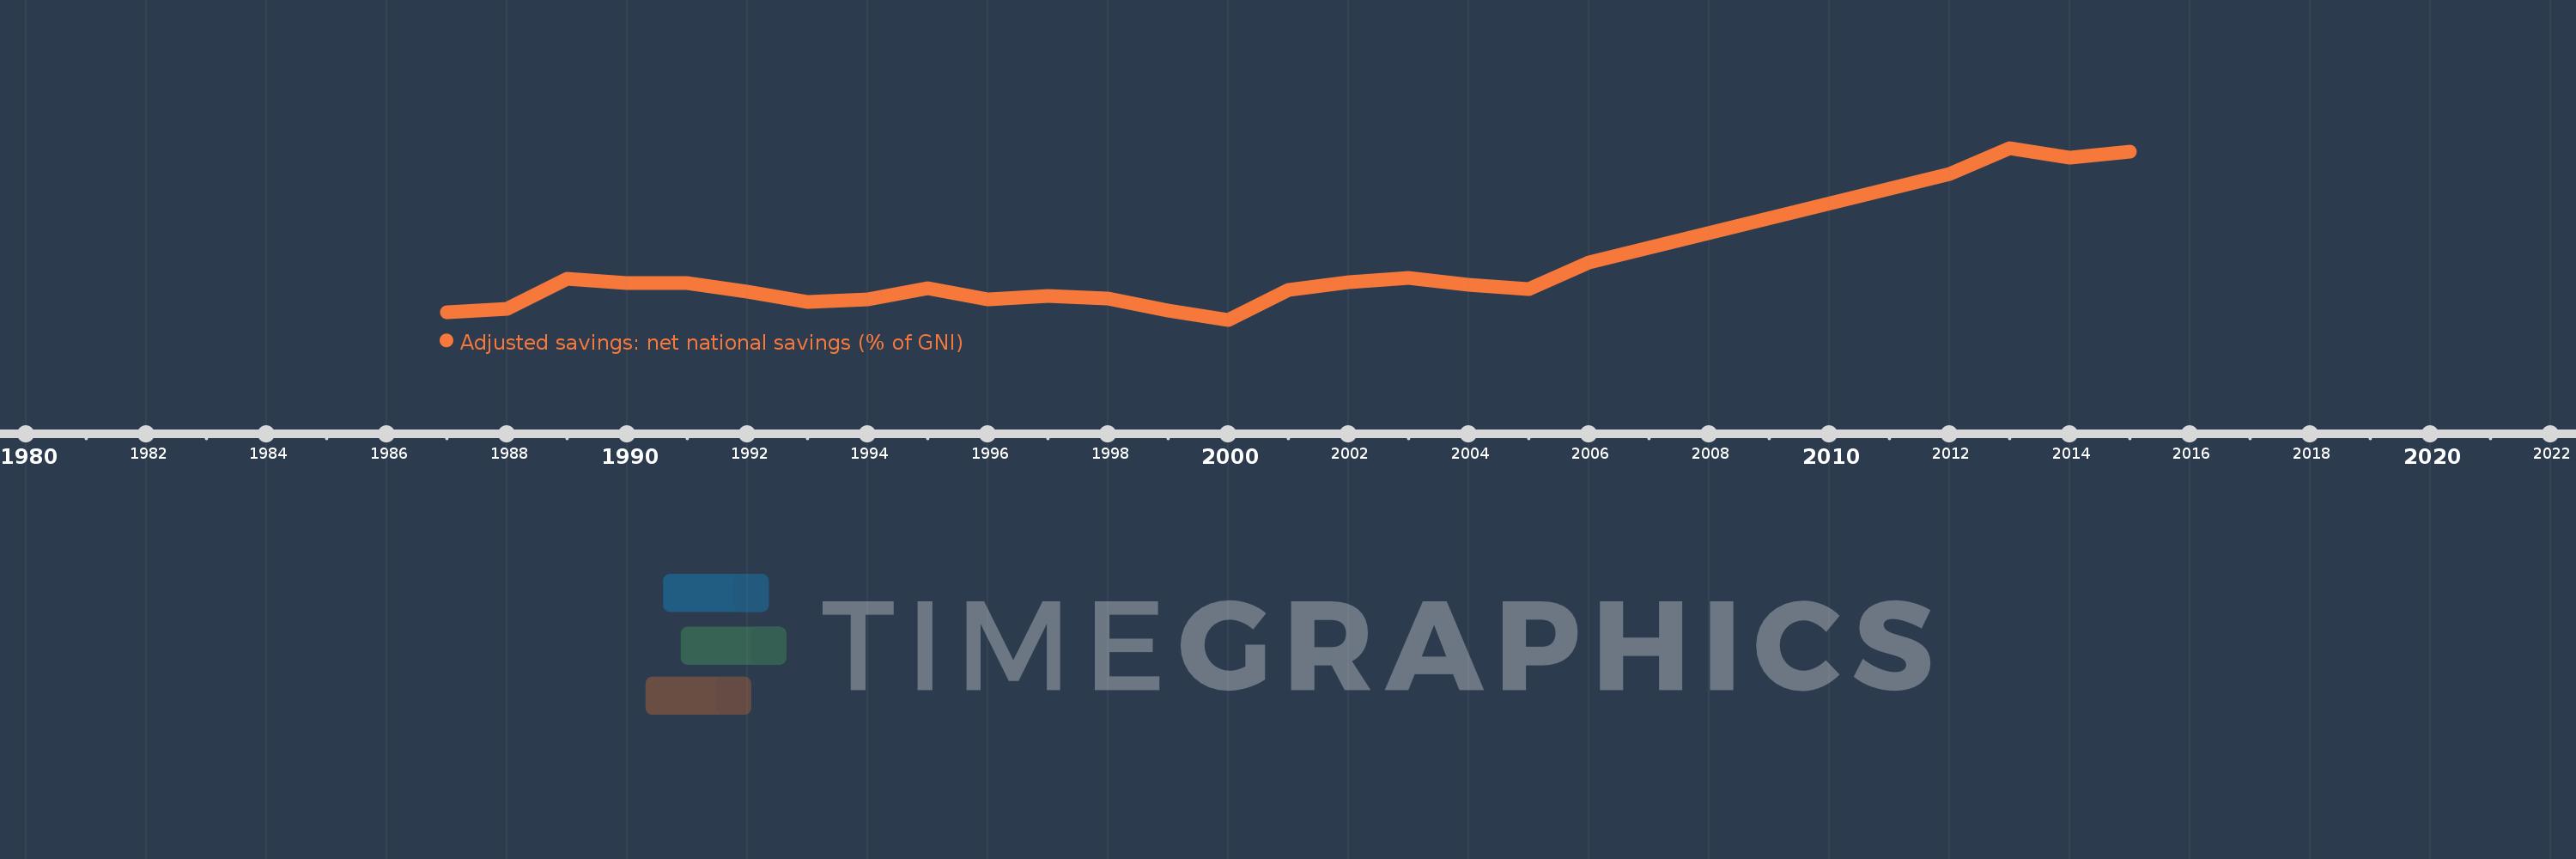
Adjusted savings: net national savings (% of GNI)
2015,2014,2013,2012,2006,2005,2004,2003,2002,2001,2000,1999,1998,1997,1996,1995,1994,1993,1992,1991,1990,1989,1988,1987
