29
/
en
AIzaSyAYiBZKx7MnpbEhh9jyipgxe19OcubqV5w
April 1, 2024
72672
Australia
AUS
true
2
1
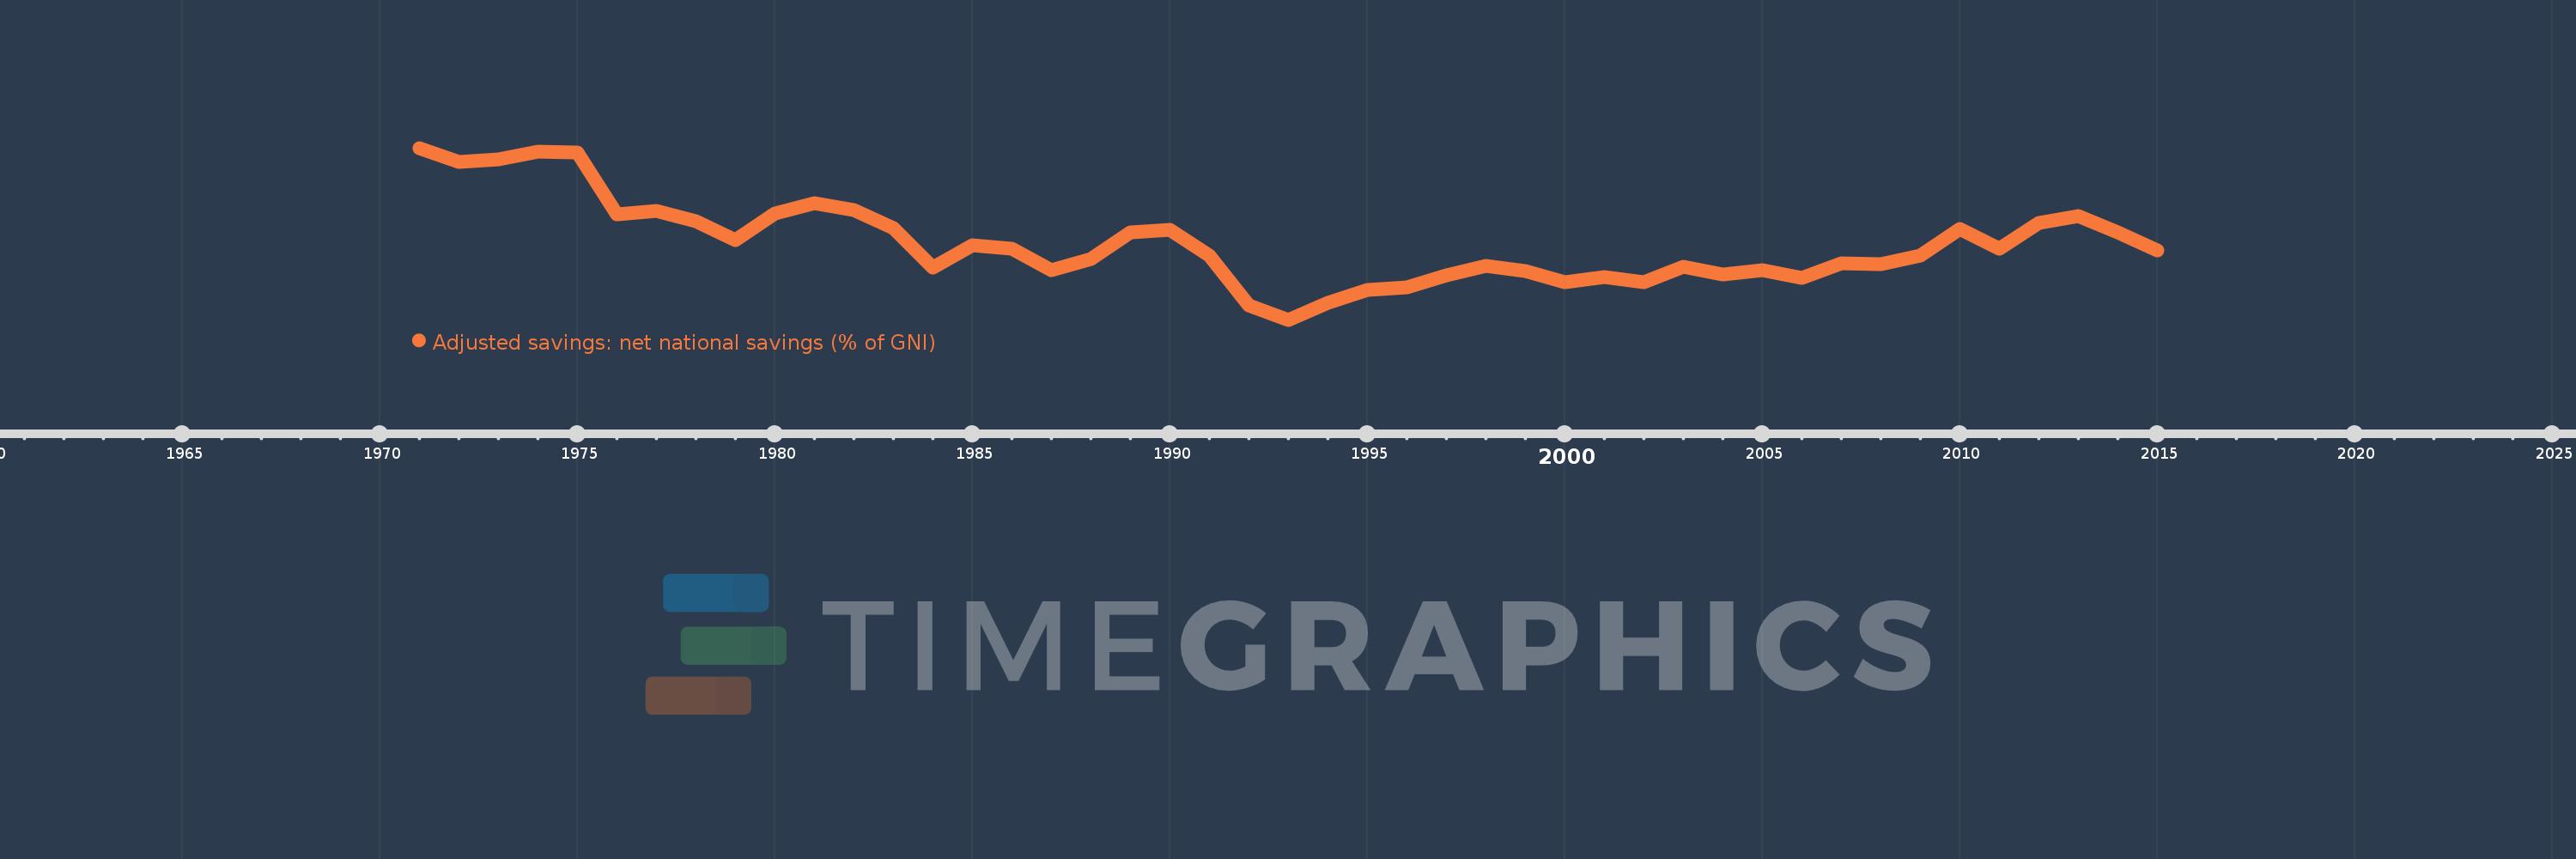
Adjusted savings: net national savings (% of GNI)
2015,2014,2013,2012,2011,2010,2009,2008,2007,2006,2005,2004,2003,2002,2001,2000,1999,1998,1997,1996,1995,1994,1993,1992,1991,1990,1989,1988,1987,1986,1985,1984,1983,1982,1981,1980,1979,1978,1977,1976,1975,1974,1973,1972,1971
This statistics in other country:
AfghanistanAlbaniaAlgeriaAngolaAntigua and BarbudaArab WorldArgentinaArmeniaAustraliaAustriaAzerbaijanBahamas, TheBahrainBangladeshBarbadosBelarusBelgiumBelizeBeninBermudaBhutanBoliviaBosnia and HerzegovinaBotswanaBrazilBrunei DarussalamBulgariaBurkina FasoBurundiCabo VerdeCambodiaCameroonCanadaCaribbean small statesCentral African RepublicCentral Europe and the BalticsChadChileChinaColombiaComorosCongo, Dem. Rep.Congo, Rep.Costa RicaCote d'IvoireCroatiaCyprusCzech RepublicDenmarkDjiboutiDominicaDominican RepublicEarly-demographic dividendEast Asia & PacificEast Asia & Pacific (excluding high income)East Asia & Pacific (IDA & IBRD countries)EcuadorEgypt, Arab Rep.El SalvadorEquatorial GuineaEritreaEstoniaEthiopiaEuro areaEurope & Central AsiaEurope & Central Asia (excluding high income)Europe & Central Asia (IDA & IBRD countries)European UnionFijiFinlandFragile and conflict affected situationsFranceGabonGambia, TheGeorgiaGermanyGhanaGreeceGrenadaGuatemalaGuineaGuinea-BissauGuyanaHaitiHeavily indebted poor countries (HIPC)High incomeHondurasHong Kong SAR, ChinaHungaryIBRD onlyIcelandIDA & IBRD totalIDA blendIDA onlyIDA totalIndiaIndonesiaIran, Islamic Rep.IraqIrelandIsraelItalyJamaicaJapanJordanKazakhstanKenyaKiribatiKorea, Rep.KosovoKuwaitKyrgyz RepublicLao PDRLate-demographic dividendLatin America & Caribbean Latin America & Caribbean (excluding high income)Latin America & the Caribbean (IDA & IBRD countries)LatviaLeast developed countries: UN classificationLebanonLesothoLiberiaLibyaLithuaniaLow & middle incomeLow incomeLower middle incomeLuxembourgMacao SAR, ChinaMacedonia, FYRMadagascarMalawiMalaysiaMaldivesMaliMaltaMauritaniaMauritiusMexicoMiddle East & North AfricaMiddle East & North Africa (excluding high income)Middle East & North Africa (IDA & IBRD countries)Middle incomeMoldovaMongoliaMontenegroMoroccoMozambiqueNamibiaNepalNetherlandsNew ZealandNicaraguaNigerNigeriaNorth AmericaNorwayOECD membersOmanOther small statesPacific island small statesPakistanPanamaPapua New GuineaParaguayPeruPhilippinesPolandPortugalPost-demographic dividendPre-demographic dividendQatarRomaniaRussian FederationRwandaSaudi ArabiaSenegalSerbiaSeychellesSierra LeoneSingaporeSlovak RepublicSloveniaSmall statesSolomon IslandsSouth AfricaSouth AsiaSouth Asia (IDA & IBRD)SpainSri LankaSt. Kitts and NevisSt. LuciaSt. Vincent and the GrenadinesSub-Saharan Africa Sub-Saharan Africa (excluding high income)Sub-Saharan Africa (IDA & IBRD countries)SudanSurinameSwazilandSwedenSwitzerlandSyrian Arab RepublicTajikistanTanzaniaThailandTimor-LesteTogoTongaTrinidad and TobagoTunisiaTurkeyTurkmenistanUgandaUkraineUnited KingdomUnited StatesUpper middle incomeUruguayVanuatuVenezuela, RBVietnamWest Bank and GazaWorldYemen, Rep.ZambiaZimbabwe Timeline:
This timeline shows a graph from 1971 to 2015 of Australia. No data until 1970. Number of actual observations by date: 45.
Source name:
World Development Indicators
Source organization:
World Bank staff estimates based on sources and methods in World Bank's "The Changing Wealth of Nations: Measuring Sustainable Development in the New Millennium" (2011).
Categories, topics:
Economy & Growth, Environment
Last updated:
apr 23, 2017
Indicators value changes by year
Maximum:
14.005
jan 1, 1971
At the date of observation
Value
Absolute change
Change from previous value
jan 1, 1971
14.005
+14.005
0.0%
jan 1, 1972
13.04
-0.964
-6.89%
jan 1, 1973
13.23
+0.19
1.46%
jan 1, 1974
13.752
+0.522
3.94%
jan 1, 1975
13.684
-0.068
-0.49%
jan 1, 1976
9.522
-4.161
-30.41%
jan 1, 1977
9.742
+0.22
2.31%
jan 1, 1978
9.051
-0.691
-7.09%
jan 1, 1979
7.795
-1.256
-13.88%
jan 1, 1980
9.594
+1.799
23.08%
jan 1, 1981
10.283
+0.689
7.18%
jan 1, 1982
9.791
-0.492
-4.79%
jan 1, 1983
8.559
-1.232
-12.58%
jan 1, 1984
5.913
-2.646
-30.91%
jan 1, 1985
7.403
+1.49
25.19%
jan 1, 1986
7.192
-0.211
-2.84%
jan 1, 1987
5.734
-1.458
-20.27%
jan 1, 1988
6.507
+0.773
13.48%
jan 1, 1989
8.289
+1.782
27.38%
jan 1, 1990
8.467
+0.178
2.15%
jan 1, 1991
6.735
-1.732
-20.46%
jan 1, 1992
3.362
-3.372
-50.07%
jan 1, 1993
2.392
-0.97
-28.85%
jan 1, 1994
3.523
+1.131
47.27%
jan 1, 1995
4.427
+0.904
25.66%
jan 1, 1996
4.561
+0.134
3.02%
jan 1, 1997
5.366
+0.805
17.66%
jan 1, 1998
6.013
+0.646
12.05%
jan 1, 1999
5.672
-0.341
-5.67%
jan 1, 2000
4.938
-0.733
-12.93%
jan 1, 2001
5.252
+0.314
6.35%
jan 1, 2002
4.901
-0.351
-6.68%
jan 1, 2003
5.983
+1.082
22.07%
jan 1, 2004
5.442
-0.54
-9.03%
jan 1, 2005
5.763
+0.321
5.89%
jan 1, 2006
5.201
-0.562
-9.75%
jan 1, 2007
6.184
+0.982
18.89%
jan 1, 2008
6.15
-0.033
-0.54%
jan 1, 2009
6.716
+0.566
9.2%
jan 1, 2010
8.528
+1.811
26.97%
jan 1, 2011
7.216
-1.312
-15.38%
jan 1, 2012
8.935
+1.719
23.82%
jan 1, 2013
9.408
+0.473
5.3%
jan 1, 2014
8.321
-1.087
-11.55%
jan 1, 2015
7.076
-1.245
-14.96%
Ranking of countries by current statistics by years


Comments: