29
/
en
AIzaSyAYiBZKx7MnpbEhh9jyipgxe19OcubqV5w
April 1, 2024
23873
Arab World
ARB
false
2
1
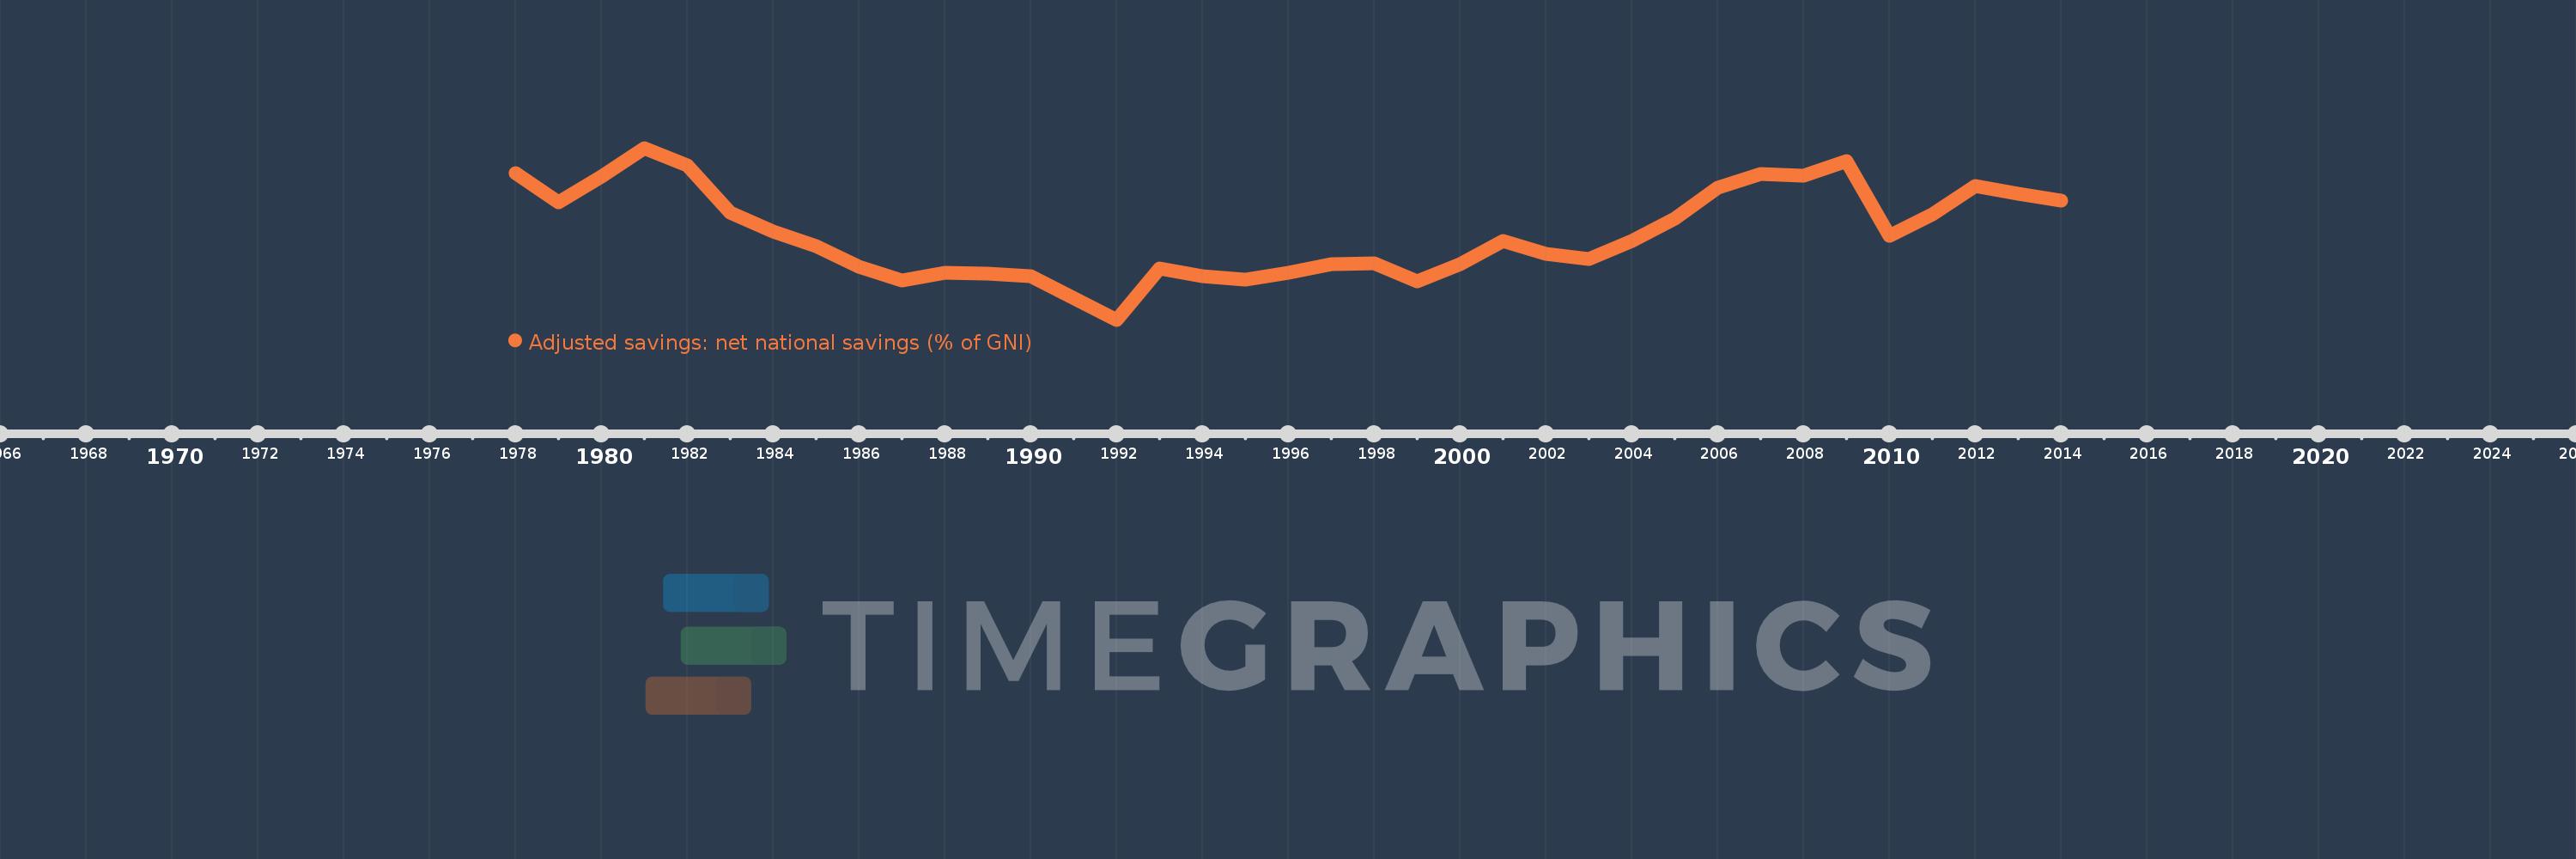
Adjusted savings: net national savings (% of GNI)
2014,2013,2012,2011,2010,2009,2008,2007,2006,2005,2004,2003,2002,2001,2000,1999,1998,1997,1996,1995,1994,1993,1992,1990,1989,1988,1987,1986,1985,1984,1983,1982,1981,1980,1979,1978
This statistics in other country:
AfghanistanAlbaniaAlgeriaAngolaAntigua and BarbudaArab WorldArgentinaArmeniaAustraliaAustriaAzerbaijanBahamas, TheBahrainBangladeshBarbadosBelarusBelgiumBelizeBeninBermudaBhutanBoliviaBosnia and HerzegovinaBotswanaBrazilBrunei DarussalamBulgariaBurkina FasoBurundiCabo VerdeCambodiaCameroonCanadaCaribbean small statesCentral African RepublicCentral Europe and the BalticsChadChileChinaColombiaComorosCongo, Dem. Rep.Congo, Rep.Costa RicaCote d'IvoireCroatiaCyprusCzech RepublicDenmarkDjiboutiDominicaDominican RepublicEarly-demographic dividendEast Asia & PacificEast Asia & Pacific (excluding high income)East Asia & Pacific (IDA & IBRD countries)EcuadorEgypt, Arab Rep.El SalvadorEquatorial GuineaEritreaEstoniaEthiopiaEuro areaEurope & Central AsiaEurope & Central Asia (excluding high income)Europe & Central Asia (IDA & IBRD countries)European UnionFijiFinlandFragile and conflict affected situationsFranceGabonGambia, TheGeorgiaGermanyGhanaGreeceGrenadaGuatemalaGuineaGuinea-BissauGuyanaHaitiHeavily indebted poor countries (HIPC)High incomeHondurasHong Kong SAR, ChinaHungaryIBRD onlyIcelandIDA & IBRD totalIDA blendIDA onlyIDA totalIndiaIndonesiaIran, Islamic Rep.IraqIrelandIsraelItalyJamaicaJapanJordanKazakhstanKenyaKiribatiKorea, Rep.KosovoKuwaitKyrgyz RepublicLao PDRLate-demographic dividendLatin America & Caribbean Latin America & Caribbean (excluding high income)Latin America & the Caribbean (IDA & IBRD countries)LatviaLeast developed countries: UN classificationLebanonLesothoLiberiaLibyaLithuaniaLow & middle incomeLow incomeLower middle incomeLuxembourgMacao SAR, ChinaMacedonia, FYRMadagascarMalawiMalaysiaMaldivesMaliMaltaMauritaniaMauritiusMexicoMiddle East & North AfricaMiddle East & North Africa (excluding high income)Middle East & North Africa (IDA & IBRD countries)Middle incomeMoldovaMongoliaMontenegroMoroccoMozambiqueNamibiaNepalNetherlandsNew ZealandNicaraguaNigerNigeriaNorth AmericaNorwayOECD membersOmanOther small statesPacific island small statesPakistanPanamaPapua New GuineaParaguayPeruPhilippinesPolandPortugalPost-demographic dividendPre-demographic dividendQatarRomaniaRussian FederationRwandaSaudi ArabiaSenegalSerbiaSeychellesSierra LeoneSingaporeSlovak RepublicSloveniaSmall statesSolomon IslandsSouth AfricaSouth AsiaSouth Asia (IDA & IBRD)SpainSri LankaSt. Kitts and NevisSt. LuciaSt. Vincent and the GrenadinesSub-Saharan Africa Sub-Saharan Africa (excluding high income)Sub-Saharan Africa (IDA & IBRD countries)SudanSurinameSwazilandSwedenSwitzerlandSyrian Arab RepublicTajikistanTanzaniaThailandTimor-LesteTogoTongaTrinidad and TobagoTunisiaTurkeyTurkmenistanUgandaUkraineUnited KingdomUnited StatesUpper middle incomeUruguayVanuatuVenezuela, RBVietnamWest Bank and GazaWorldYemen, Rep.ZambiaZimbabwe Timeline:
This timeline shows a graph from 1978 to 2014 of Arab World. No data until 1977. Number of actual observations by date: 36.
Source name:
World Development Indicators
Source organization:
World Bank staff estimates based on sources and methods in World Bank's "The Changing Wealth of Nations: Measuring Sustainable Development in the New Millennium" (2011).
Categories, topics:
Economy & Growth, Environment
Last updated:
apr 23, 2017
Indicators value changes by year
Maximum:
39.002
jan 1, 1981
At the date of observation
Value
Absolute change
Change from previous value
jan 1, 1978
33.387
+33.387
0.0%
jan 1, 1979
27.041
-6.346
-19.01%
jan 1, 1980
32.608
+5.567
20.59%
jan 1, 1981
39.002
+6.394
19.61%
jan 1, 1982
35.194
-3.809
-9.77%
jan 1, 1983
24.647
-10.547
-29.97%
jan 1, 1984
20.584
-4.063
-16.48%
jan 1, 1985
17.267
-3.317
-16.11%
jan 1, 1986
12.725
-4.542
-26.31%
jan 1, 1987
9.794
-2.931
-23.04%
jan 1, 1988
11.509
+1.716
17.52%
jan 1, 1989
11.191
-0.319
-2.77%
jan 1, 1990
10.712
-0.479
-4.28%
jan 1, 1992
1.051
-9.661
-90.19%
jan 1, 1993
12.346
+11.295
1.07K%
jan 1, 1994
10.585
-1.761
-14.26%
jan 1, 1995
9.962
-0.622
-5.88%
jan 1, 1996
11.514
+1.552
15.58%
jan 1, 1997
13.397
+1.883
16.35%
jan 1, 1998
13.496
+0.099
0.74%
jan 1, 1999
9.442
-4.054
-30.04%
jan 1, 2000
13.275
+3.833
40.6%
jan 1, 2001
18.369
+5.094
38.37%
jan 1, 2002
15.54
-2.829
-15.4%
jan 1, 2003
14.538
-1.003
-6.45%
jan 1, 2004
18.521
+3.984
27.4%
jan 1, 2005
23.474
+4.953
26.74%
jan 1, 2006
30.299
+6.825
29.07%
jan 1, 2007
33.279
+2.98
9.83%
jan 1, 2008
32.868
-0.411
-1.24%
jan 1, 2009
36.014
+3.147
9.57%
jan 1, 2010
19.577
-16.437
-45.64%
jan 1, 2011
24.33
+4.753
24.28%
jan 1, 2012
30.689
+6.359
26.14%
jan 1, 2013
28.824
-1.865
-6.08%
jan 1, 2014
27.364
-1.46
-5.07%
Ranking of countries by current statistics by years


Comments: