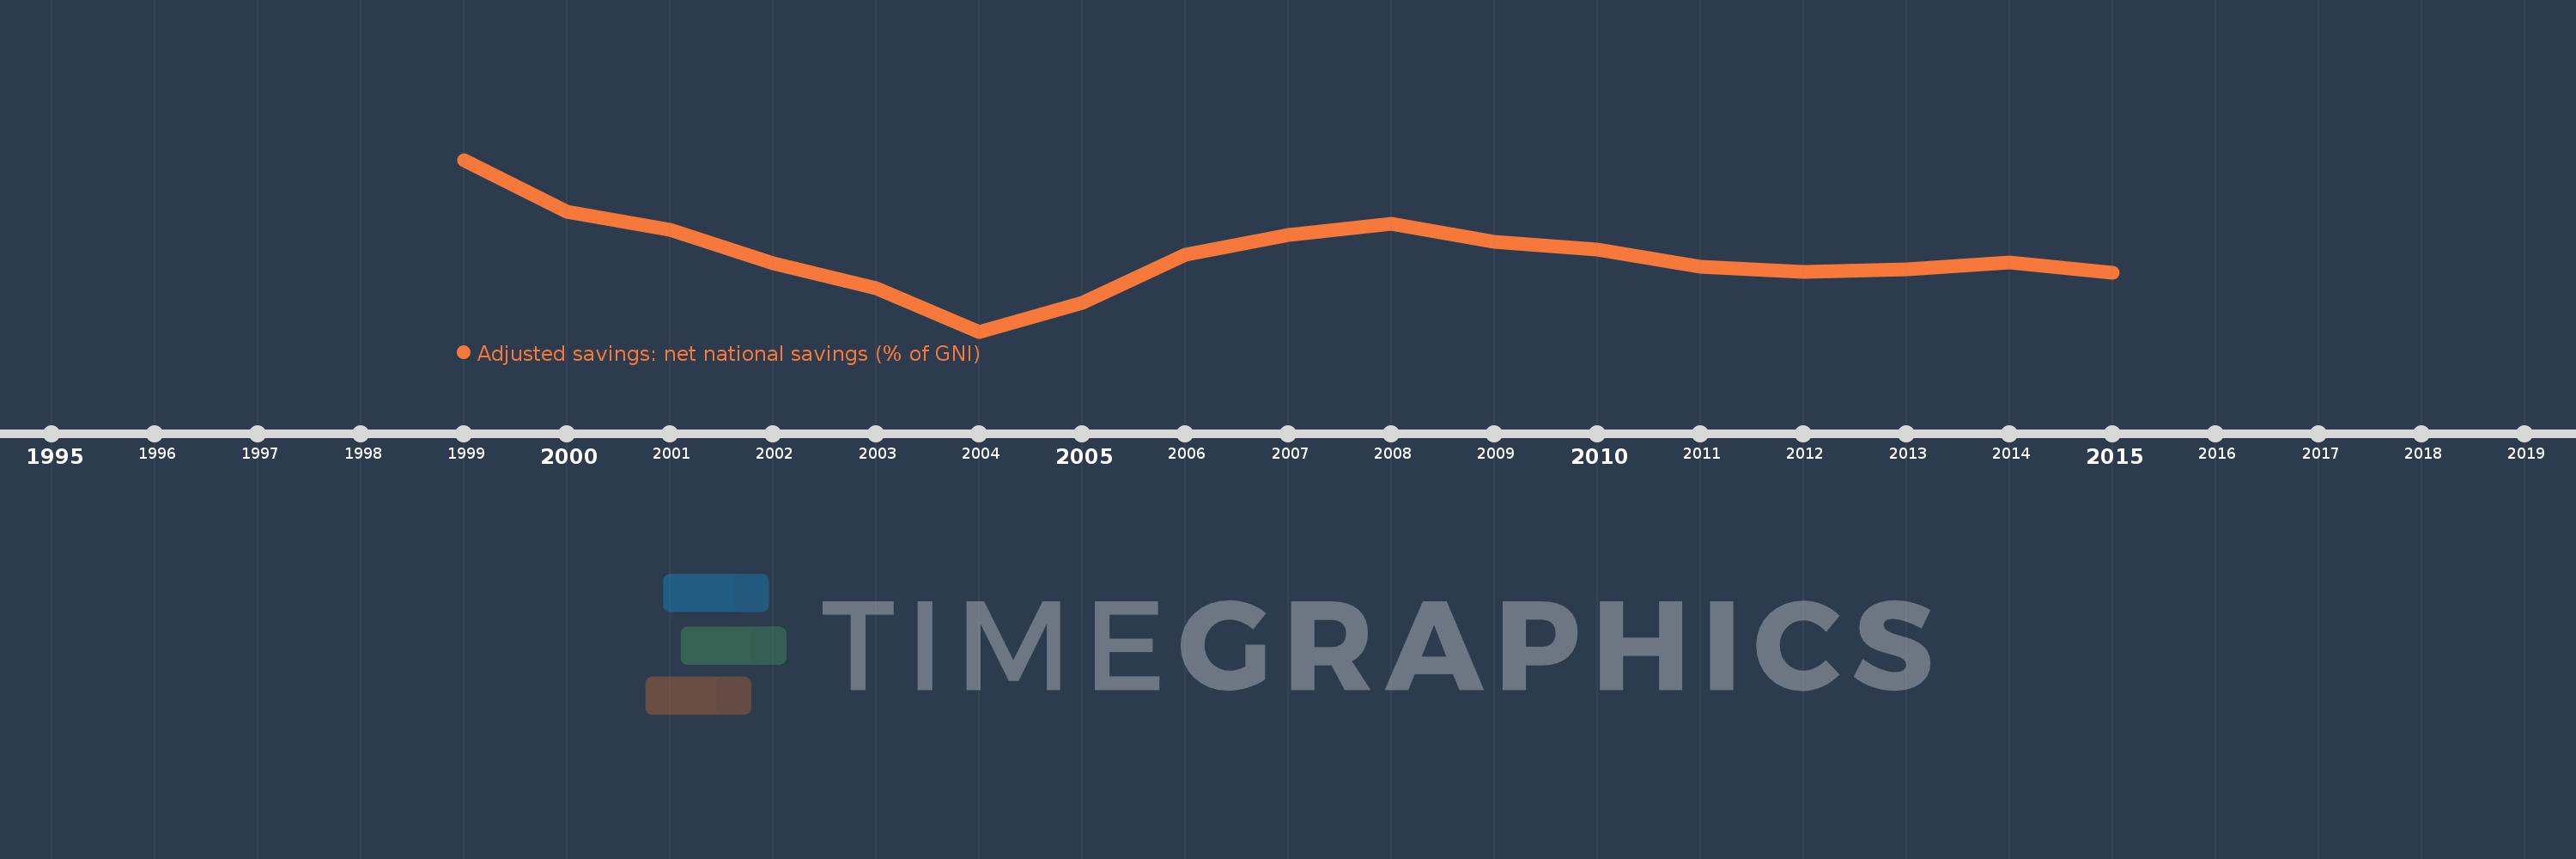
This timeline shows a graph from 1999 to 2015 of Bosnia and Herzegovina. No data until 1998. Number of actual observations by date: 17.
Source name:
World Development Indicators
Source organization:
World Bank staff estimates based on sources and methods in World Bank's "The Changing Wealth of Nations: Measuring Sustainable Development in the New Millennium" (2011).
Categories, topics:
Economy & Growth, Environment
Last updated:
apr 23, 2017
Indicators value changes by year
Meaning:
1.264
Minimum:
-14.482
jan 1, 2004
Maximum:
20.869
jan 1, 1999
At the date of observation
Value
Absolute change
Change from the previous value
jan 1, 1999
20.869
+20.869
0.0%
jan 1, 2000
10.15
-10.719
-51.36%
jan 1, 2001
6.481
-3.668
-36.14%
jan 1, 2002
-0.469
-6.95
-107.24%
jan 1, 2003
-5.474
-5.005
1.07K%
jan 1, 2004
-14.482
-9.008
164.55%
jan 1, 2005
-8.519
+5.963
-41.18%
jan 1, 2006
1.337
+9.856
-115.69%
jan 1, 2007
5.382
+4.045
302.6%
jan 1, 2008
7.674
+2.292
42.58%
jan 1, 2009
3.926
-3.748
-48.85%
jan 1, 2010
2.343
-1.582
-40.3%
jan 1, 2011
-1.127
-3.471
-148.1%
jan 1, 2012
-2.205
-1.078
95.61%
jan 1, 2013
-1.732
+0.473
-21.44%
jan 1, 2014
-0.285
+1.447
-83.55%
jan 1, 2015
-2.382
-2.097
735.88%
Ranking of countries by current statistics by years
