29
/
en
AIzaSyAYiBZKx7MnpbEhh9jyipgxe19OcubqV5w
April 1, 2024
202511
Mozambique
MOZ
true
2
1
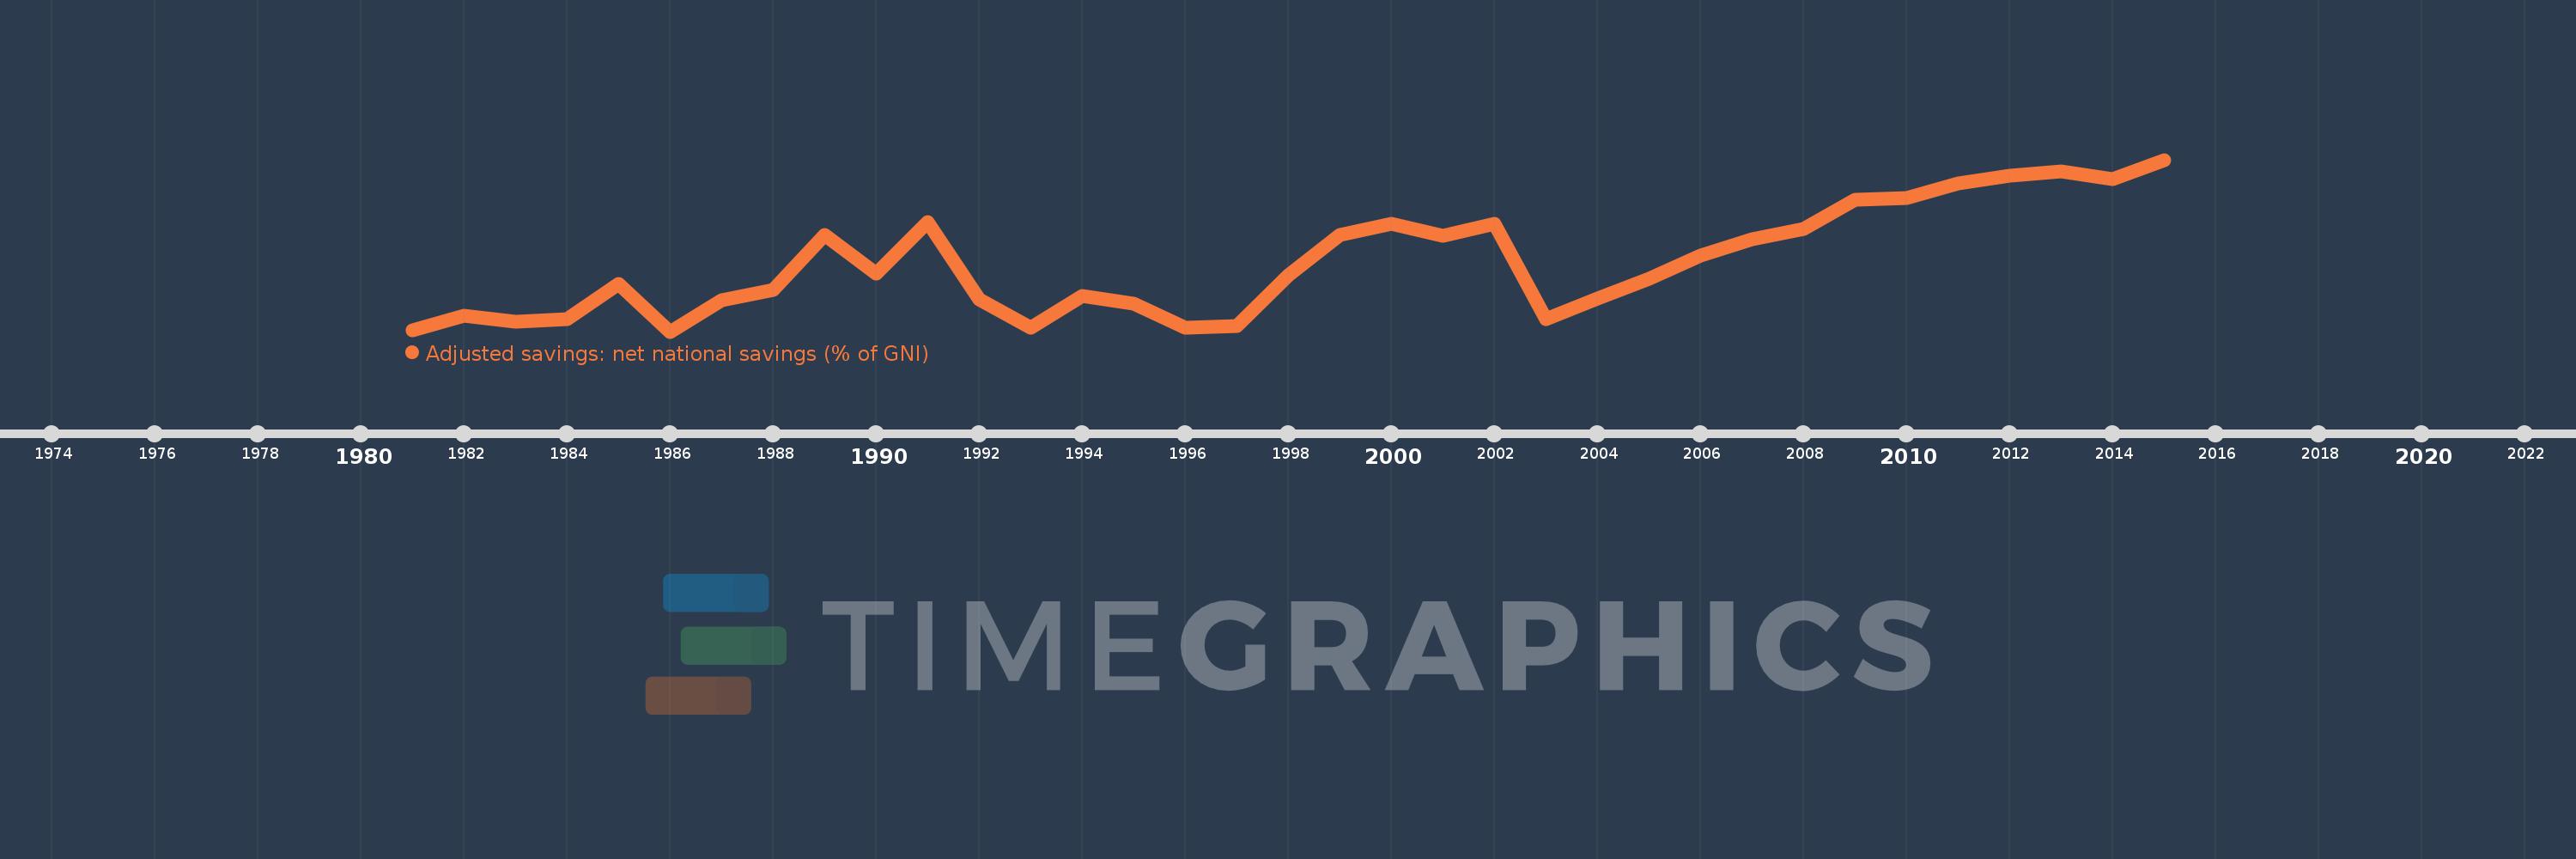
Adjusted savings: net national savings (% of GNI)
2015,2014,2013,2012,2011,2010,2009,2008,2007,2006,2005,2004,2003,2002,2001,2000,1999,1998,1997,1996,1995,1994,1993,1992,1991,1990,1989,1988,1987,1986,1985,1984,1983,1982,1981
This statistics in other country:
AfghanistanAlbaniaAlgeriaAngolaAntigua and BarbudaArab WorldArgentinaArmeniaAustraliaAustriaAzerbaijanBahamas, TheBahrainBangladeshBarbadosBelarusBelgiumBelizeBeninBermudaBhutanBoliviaBosnia and HerzegovinaBotswanaBrazilBrunei DarussalamBulgariaBurkina FasoBurundiCabo VerdeCambodiaCameroonCanadaCaribbean small statesCentral African RepublicCentral Europe and the BalticsChadChileChinaColombiaComorosCongo, Dem. Rep.Congo, Rep.Costa RicaCote d'IvoireCroatiaCyprusCzech RepublicDenmarkDjiboutiDominicaDominican RepublicEarly-demographic dividendEast Asia & PacificEast Asia & Pacific (excluding high income)East Asia & Pacific (IDA & IBRD countries)EcuadorEgypt, Arab Rep.El SalvadorEquatorial GuineaEritreaEstoniaEthiopiaEuro areaEurope & Central AsiaEurope & Central Asia (excluding high income)Europe & Central Asia (IDA & IBRD countries)European UnionFijiFinlandFragile and conflict affected situationsFranceGabonGambia, TheGeorgiaGermanyGhanaGreeceGrenadaGuatemalaGuineaGuinea-BissauGuyanaHaitiHeavily indebted poor countries (HIPC)High incomeHondurasHong Kong SAR, ChinaHungaryIBRD onlyIcelandIDA & IBRD totalIDA blendIDA onlyIDA totalIndiaIndonesiaIran, Islamic Rep.IraqIrelandIsraelItalyJamaicaJapanJordanKazakhstanKenyaKiribatiKorea, Rep.KosovoKuwaitKyrgyz RepublicLao PDRLate-demographic dividendLatin America & Caribbean Latin America & Caribbean (excluding high income)Latin America & the Caribbean (IDA & IBRD countries)LatviaLeast developed countries: UN classificationLebanonLesothoLiberiaLibyaLithuaniaLow & middle incomeLow incomeLower middle incomeLuxembourgMacao SAR, ChinaMacedonia, FYRMadagascarMalawiMalaysiaMaldivesMaliMaltaMauritaniaMauritiusMexicoMiddle East & North AfricaMiddle East & North Africa (excluding high income)Middle East & North Africa (IDA & IBRD countries)Middle incomeMoldovaMongoliaMontenegroMoroccoMozambiqueNamibiaNepalNetherlandsNew ZealandNicaraguaNigerNigeriaNorth AmericaNorwayOECD membersOmanOther small statesPacific island small statesPakistanPanamaPapua New GuineaParaguayPeruPhilippinesPolandPortugalPost-demographic dividendPre-demographic dividendQatarRomaniaRussian FederationRwandaSaudi ArabiaSenegalSerbiaSeychellesSierra LeoneSingaporeSlovak RepublicSloveniaSmall statesSolomon IslandsSouth AfricaSouth AsiaSouth Asia (IDA & IBRD)SpainSri LankaSt. Kitts and NevisSt. LuciaSt. Vincent and the GrenadinesSub-Saharan Africa Sub-Saharan Africa (excluding high income)Sub-Saharan Africa (IDA & IBRD countries)SudanSurinameSwazilandSwedenSwitzerlandSyrian Arab RepublicTajikistanTanzaniaThailandTimor-LesteTogoTongaTrinidad and TobagoTunisiaTurkeyTurkmenistanUgandaUkraineUnited KingdomUnited StatesUpper middle incomeUruguayVanuatuVenezuela, RBVietnamWest Bank and GazaWorldYemen, Rep.ZambiaZimbabwe Timeline:
This timeline shows a graph from 1981 to 2015 of Mozambique. No data until 1980. Number of actual observations by date: 35.
Source name:
World Development Indicators
Source organization:
World Bank staff estimates based on sources and methods in World Bank's "The Changing Wealth of Nations: Measuring Sustainable Development in the New Millennium" (2011).
Categories, topics:
Economy & Growth, Environment
Last updated:
apr 23, 2017
Indicators value changes by year
Minimum:
-15.874
jan 1, 1986
At the date of observation
Value
Absolute change
Change from previous value
jan 1, 1981
-15.674
-15.674
0.0%
jan 1, 1982
-13.898
+1.776
-11.33%
jan 1, 1983
-14.583
-0.684
4.92%
jan 1, 1984
-14.344
+0.238
-1.63%
jan 1, 1985
-9.878
+4.466
-31.14%
jan 1, 1986
-15.874
-5.996
60.7%
jan 1, 1987
-11.873
+4.001
-25.21%
jan 1, 1988
-10.655
+1.218
-10.26%
jan 1, 1989
-3.727
+6.928
-65.02%
jan 1, 1990
-8.602
-4.875
130.79%
jan 1, 1991
-2.057
+6.545
-76.09%
jan 1, 1992
-11.773
-9.716
472.42%
jan 1, 1993
-15.405
-3.632
30.85%
jan 1, 1994
-11.33
+4.075
-26.45%
jan 1, 1995
-12.342
-1.012
8.93%
jan 1, 1996
-15.345
-3.004
24.34%
jan 1, 1997
-15.224
+0.122
-0.79%
jan 1, 1998
-8.822
+6.401
-42.05%
jan 1, 1999
-3.75
+5.072
-57.5%
jan 1, 2000
-2.256
+1.494
-39.84%
jan 1, 2001
-3.851
-1.595
70.7%
jan 1, 2002
-2.329
+1.521
-39.51%
jan 1, 2003
-14.32
-11.991
514.75%
jan 1, 2004
-11.736
+2.585
-18.05%
jan 1, 2005
-9.26
+2.475
-21.09%
jan 1, 2006
-6.319
+2.941
-31.76%
jan 1, 2007
-4.273
+2.046
-32.38%
jan 1, 2008
-2.935
+1.338
-31.32%
jan 1, 2009
0.757
+3.692
-125.81%
jan 1, 2010
0.933
+0.176
23.22%
jan 1, 2011
2.778
+1.844
197.63%
jan 1, 2012
3.754
+0.976
35.14%
jan 1, 2013
4.326
+0.572
15.24%
jan 1, 2014
3.372
-0.954
-22.05%
jan 1, 2015
5.771
+2.399
71.15%
Ranking of countries by current statistics by years


Comments: