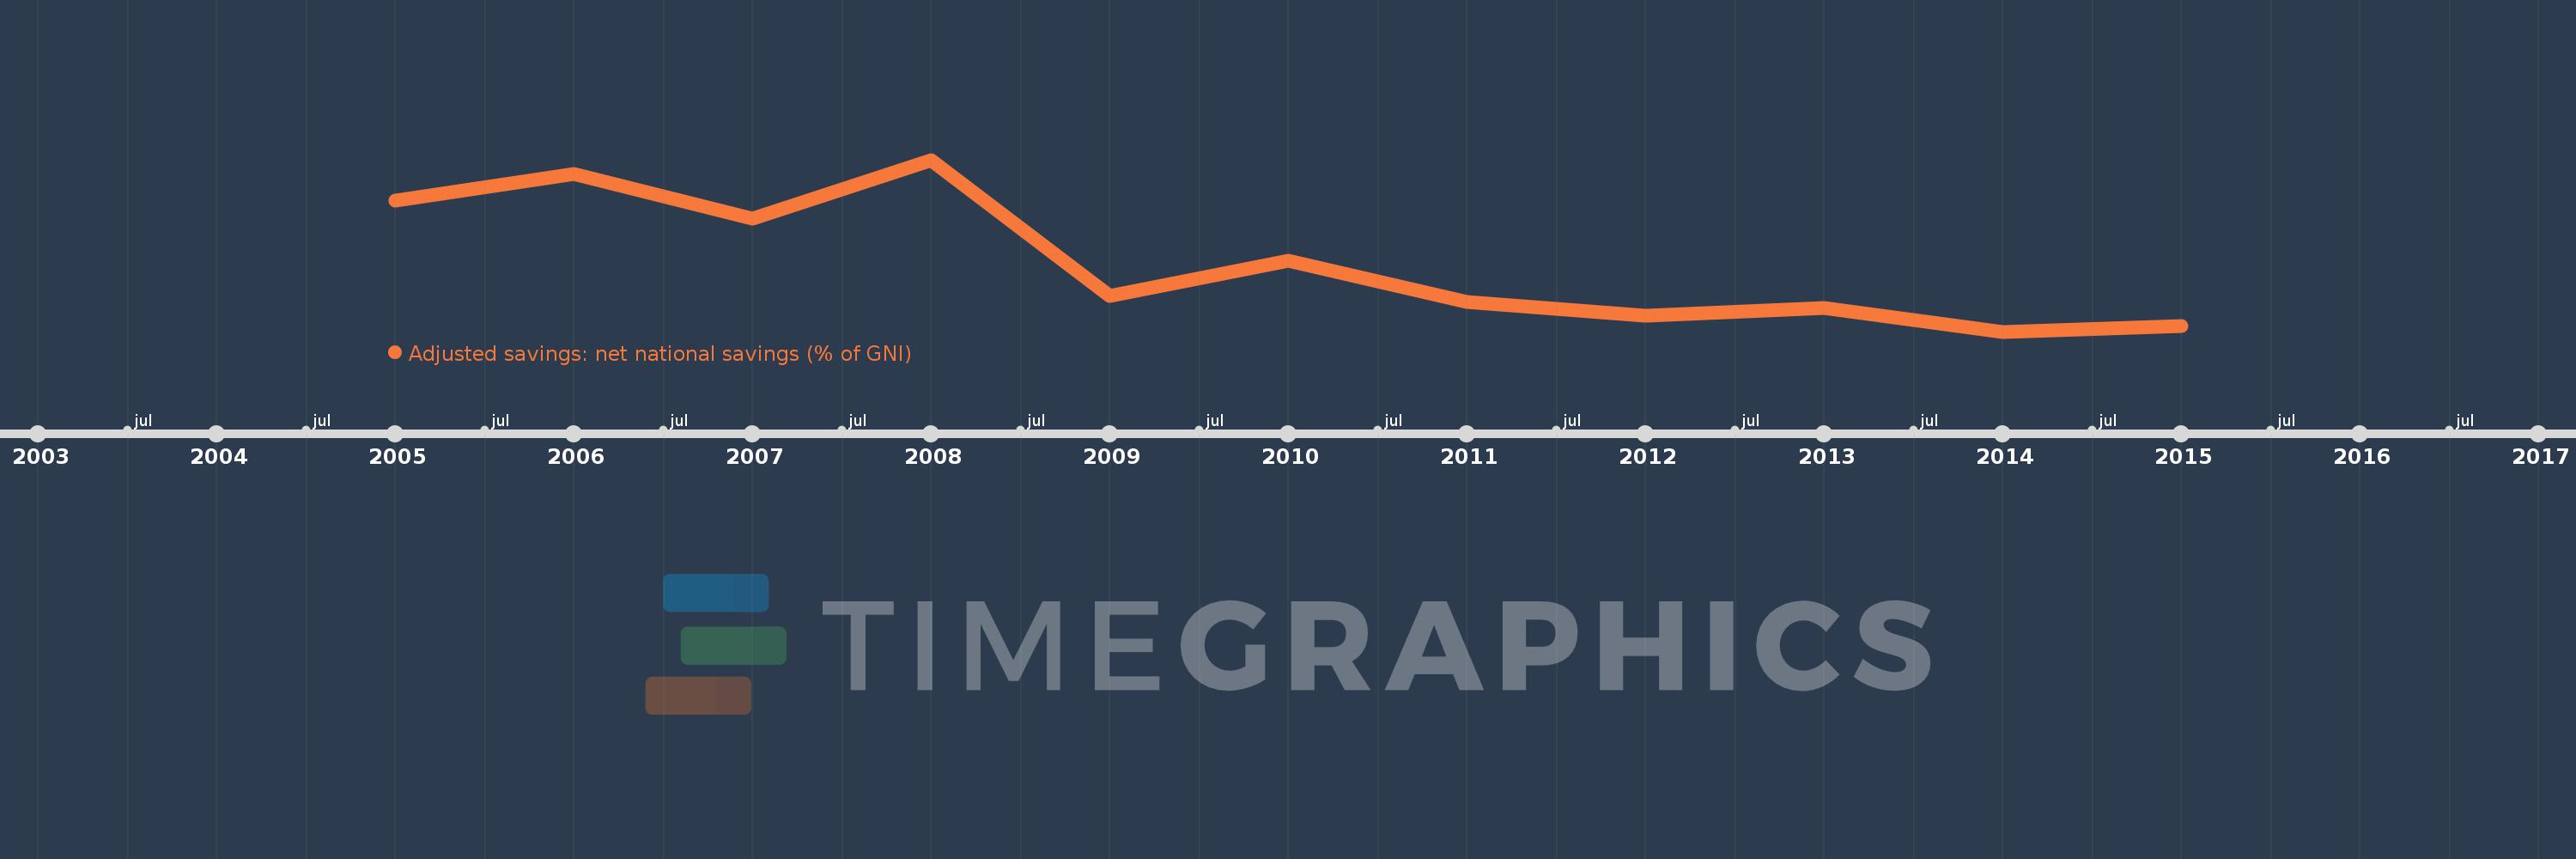
This timeline shows a graph from 2005 to 2015 of Haiti. No data until 2004. Number of actual observations by date: 11.
Source name:
World Development Indicators
Source organization:
World Bank staff estimates based on sources and methods in World Bank's "The Changing Wealth of Nations: Measuring Sustainable Development in the New Millennium" (2011).
Categories, topics:
Economy & Growth, Environment
Last updated:
apr 23, 2017
Indicators value changes by year
Meaning:
22.408
Minimum:
18.912
jan 1, 2014
Maximum:
27.663
jan 1, 2008
At the date of observation
Value
Absolute change
Change from the previous value
jan 1, 2005
25.604
+25.604
0.0%
jan 1, 2006
26.939
+1.335
5.21%
jan 1, 2007
24.658
-2.281
-8.47%
jan 1, 2008
27.663
+3.005
12.19%
jan 1, 2009
20.743
-6.92
-25.01%
jan 1, 2010
22.515
+1.772
8.54%
jan 1, 2011
20.419
-2.096
-9.31%
jan 1, 2012
19.707
-0.712
-3.48%
jan 1, 2013
20.114
+0.407
2.06%
jan 1, 2014
18.912
-1.202
-5.98%
jan 1, 2015
19.212
+0.3
1.58%
Ranking of countries by current statistics by years
