29
/
en
AIzaSyAYiBZKx7MnpbEhh9jyipgxe19OcubqV5w
April 1, 2024
120636
Dominica
DMA
true
2
1
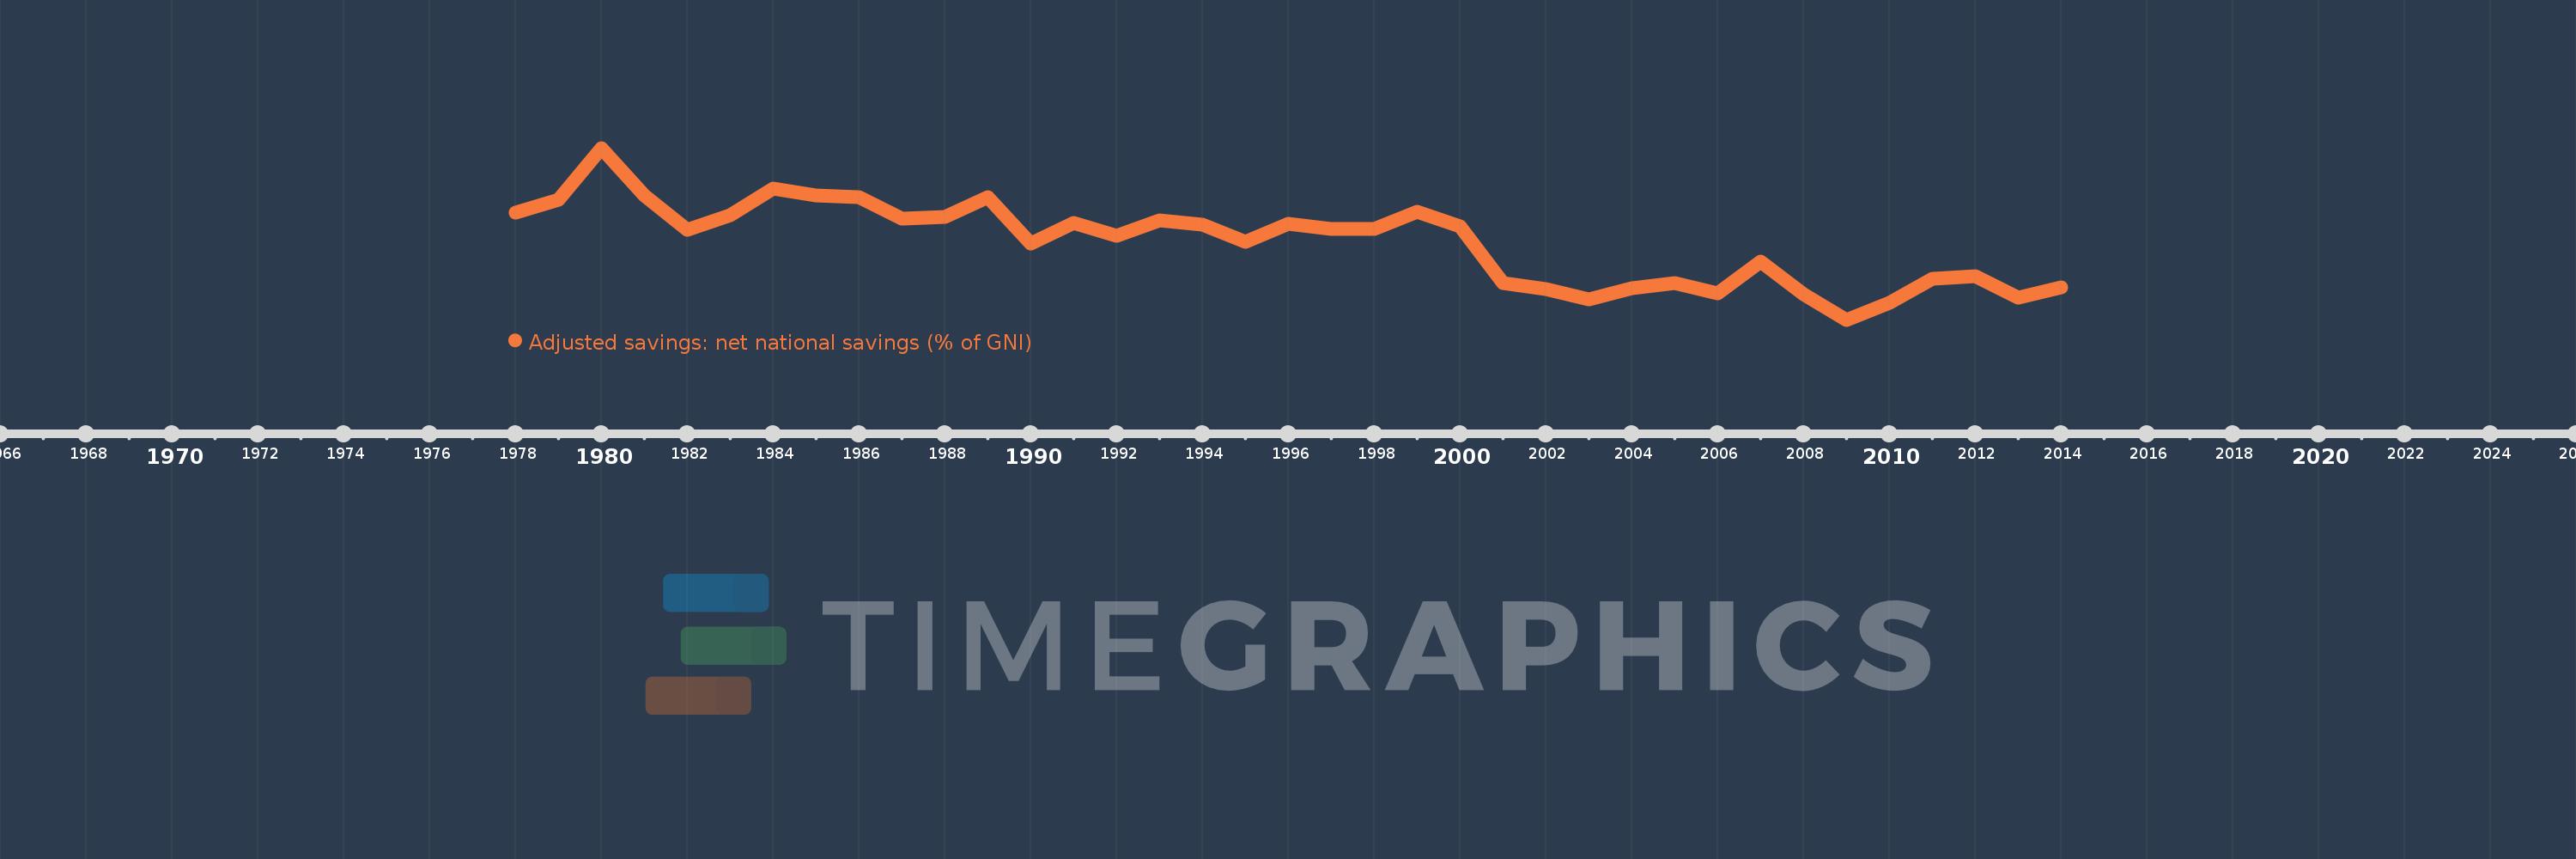
Adjusted savings: net national savings (% of GNI)
2014,2013,2012,2011,2010,2009,2008,2007,2006,2005,2004,2003,2002,2001,2000,1999,1998,1997,1996,1995,1994,1993,1992,1991,1990,1989,1988,1987,1986,1985,1984,1983,1982,1981,1980,1979,1978
This statistics in other country:
AfghanistanAlbaniaAlgeriaAngolaAntigua and BarbudaArab WorldArgentinaArmeniaAustraliaAustriaAzerbaijanBahamas, TheBahrainBangladeshBarbadosBelarusBelgiumBelizeBeninBermudaBhutanBoliviaBosnia and HerzegovinaBotswanaBrazilBrunei DarussalamBulgariaBurkina FasoBurundiCabo VerdeCambodiaCameroonCanadaCaribbean small statesCentral African RepublicCentral Europe and the BalticsChadChileChinaColombiaComorosCongo, Dem. Rep.Congo, Rep.Costa RicaCote d'IvoireCroatiaCyprusCzech RepublicDenmarkDjiboutiDominicaDominican RepublicEarly-demographic dividendEast Asia & PacificEast Asia & Pacific (excluding high income)East Asia & Pacific (IDA & IBRD countries)EcuadorEgypt, Arab Rep.El SalvadorEquatorial GuineaEritreaEstoniaEthiopiaEuro areaEurope & Central AsiaEurope & Central Asia (excluding high income)Europe & Central Asia (IDA & IBRD countries)European UnionFijiFinlandFragile and conflict affected situationsFranceGabonGambia, TheGeorgiaGermanyGhanaGreeceGrenadaGuatemalaGuineaGuinea-BissauGuyanaHaitiHeavily indebted poor countries (HIPC)High incomeHondurasHong Kong SAR, ChinaHungaryIBRD onlyIcelandIDA & IBRD totalIDA blendIDA onlyIDA totalIndiaIndonesiaIran, Islamic Rep.IraqIrelandIsraelItalyJamaicaJapanJordanKazakhstanKenyaKiribatiKorea, Rep.KosovoKuwaitKyrgyz RepublicLao PDRLate-demographic dividendLatin America & Caribbean Latin America & Caribbean (excluding high income)Latin America & the Caribbean (IDA & IBRD countries)LatviaLeast developed countries: UN classificationLebanonLesothoLiberiaLibyaLithuaniaLow & middle incomeLow incomeLower middle incomeLuxembourgMacao SAR, ChinaMacedonia, FYRMadagascarMalawiMalaysiaMaldivesMaliMaltaMauritaniaMauritiusMexicoMiddle East & North AfricaMiddle East & North Africa (excluding high income)Middle East & North Africa (IDA & IBRD countries)Middle incomeMoldovaMongoliaMontenegroMoroccoMozambiqueNamibiaNepalNetherlandsNew ZealandNicaraguaNigerNigeriaNorth AmericaNorwayOECD membersOmanOther small statesPacific island small statesPakistanPanamaPapua New GuineaParaguayPeruPhilippinesPolandPortugalPost-demographic dividendPre-demographic dividendQatarRomaniaRussian FederationRwandaSaudi ArabiaSenegalSerbiaSeychellesSierra LeoneSingaporeSlovak RepublicSloveniaSmall statesSolomon IslandsSouth AfricaSouth AsiaSouth Asia (IDA & IBRD)SpainSri LankaSt. Kitts and NevisSt. LuciaSt. Vincent and the GrenadinesSub-Saharan Africa Sub-Saharan Africa (excluding high income)Sub-Saharan Africa (IDA & IBRD countries)SudanSurinameSwazilandSwedenSwitzerlandSyrian Arab RepublicTajikistanTanzaniaThailandTimor-LesteTogoTongaTrinidad and TobagoTunisiaTurkeyTurkmenistanUgandaUkraineUnited KingdomUnited StatesUpper middle incomeUruguayVanuatuVenezuela, RBVietnamWest Bank and GazaWorldYemen, Rep.ZambiaZimbabwe Timeline:
This timeline shows a graph from 1978 to 2014 of Dominica. No data until 1977. Number of actual observations by date: 37.
Source name:
World Development Indicators
Source organization:
World Bank staff estimates based on sources and methods in World Bank's "The Changing Wealth of Nations: Measuring Sustainable Development in the New Millennium" (2011).
Categories, topics:
Economy & Growth, Environment
Last updated:
apr 23, 2017
Indicators value changes by year
Minimum:
-10.981
jan 1, 2009
Maximum:
30.389
jan 1, 1980
At the date of observation
Value
Absolute change
Change from previous value
jan 1, 1978
14.745
+14.745
0.0%
jan 1, 1979
17.963
+3.218
21.82%
jan 1, 1980
30.389
+12.425
69.17%
jan 1, 1981
18.954
-11.434
-37.63%
jan 1, 1982
10.643
-8.311
-43.85%
jan 1, 1983
14.112
+3.469
32.59%
jan 1, 1984
20.596
+6.484
45.94%
jan 1, 1985
18.872
-1.723
-8.37%
jan 1, 1986
18.522
-0.351
-1.86%
jan 1, 1987
13.428
-5.093
-27.5%
jan 1, 1988
13.864
+0.436
3.24%
jan 1, 1989
18.632
+4.769
34.4%
jan 1, 1990
7.274
-11.358
-60.96%
jan 1, 1991
12.336
+5.062
69.59%
jan 1, 1992
9.316
-3.021
-24.48%
jan 1, 1993
12.922
+3.606
38.71%
jan 1, 1994
11.892
-1.03
-7.97%
jan 1, 1995
7.793
-4.099
-34.47%
jan 1, 1996
12.2
+4.407
56.55%
jan 1, 1997
10.821
-1.379
-11.3%
jan 1, 1998
10.824
+0.003
0.03%
jan 1, 1999
15.035
+4.211
38.91%
jan 1, 2000
11.601
-3.435
-22.84%
jan 1, 2001
-2.118
-13.719
-118.26%
jan 1, 2002
-3.615
-1.497
70.67%
jan 1, 2003
-6.008
-2.393
66.21%
jan 1, 2004
-3.486
+2.522
-41.98%
jan 1, 2005
-2.17
+1.316
-37.75%
jan 1, 2006
-4.704
-2.534
116.81%
jan 1, 2007
2.945
+7.649
-162.61%
jan 1, 2008
-4.9
-7.845
-266.37%
jan 1, 2009
-10.981
-6.081
124.1%
jan 1, 2010
-6.961
+4.02
-36.61%
jan 1, 2011
-1.184
+5.777
-82.99%
jan 1, 2012
-0.413
+0.771
-65.12%
jan 1, 2013
-5.572
-5.159
1.25K%
jan 1, 2014
-3.124
+2.448
-43.93%
Ranking of countries by current statistics by years


Comments: