29
/
en
AIzaSyAYiBZKx7MnpbEhh9jyipgxe19OcubqV5w
April 1, 2024
164437
Jordan
JOR
true
2
1
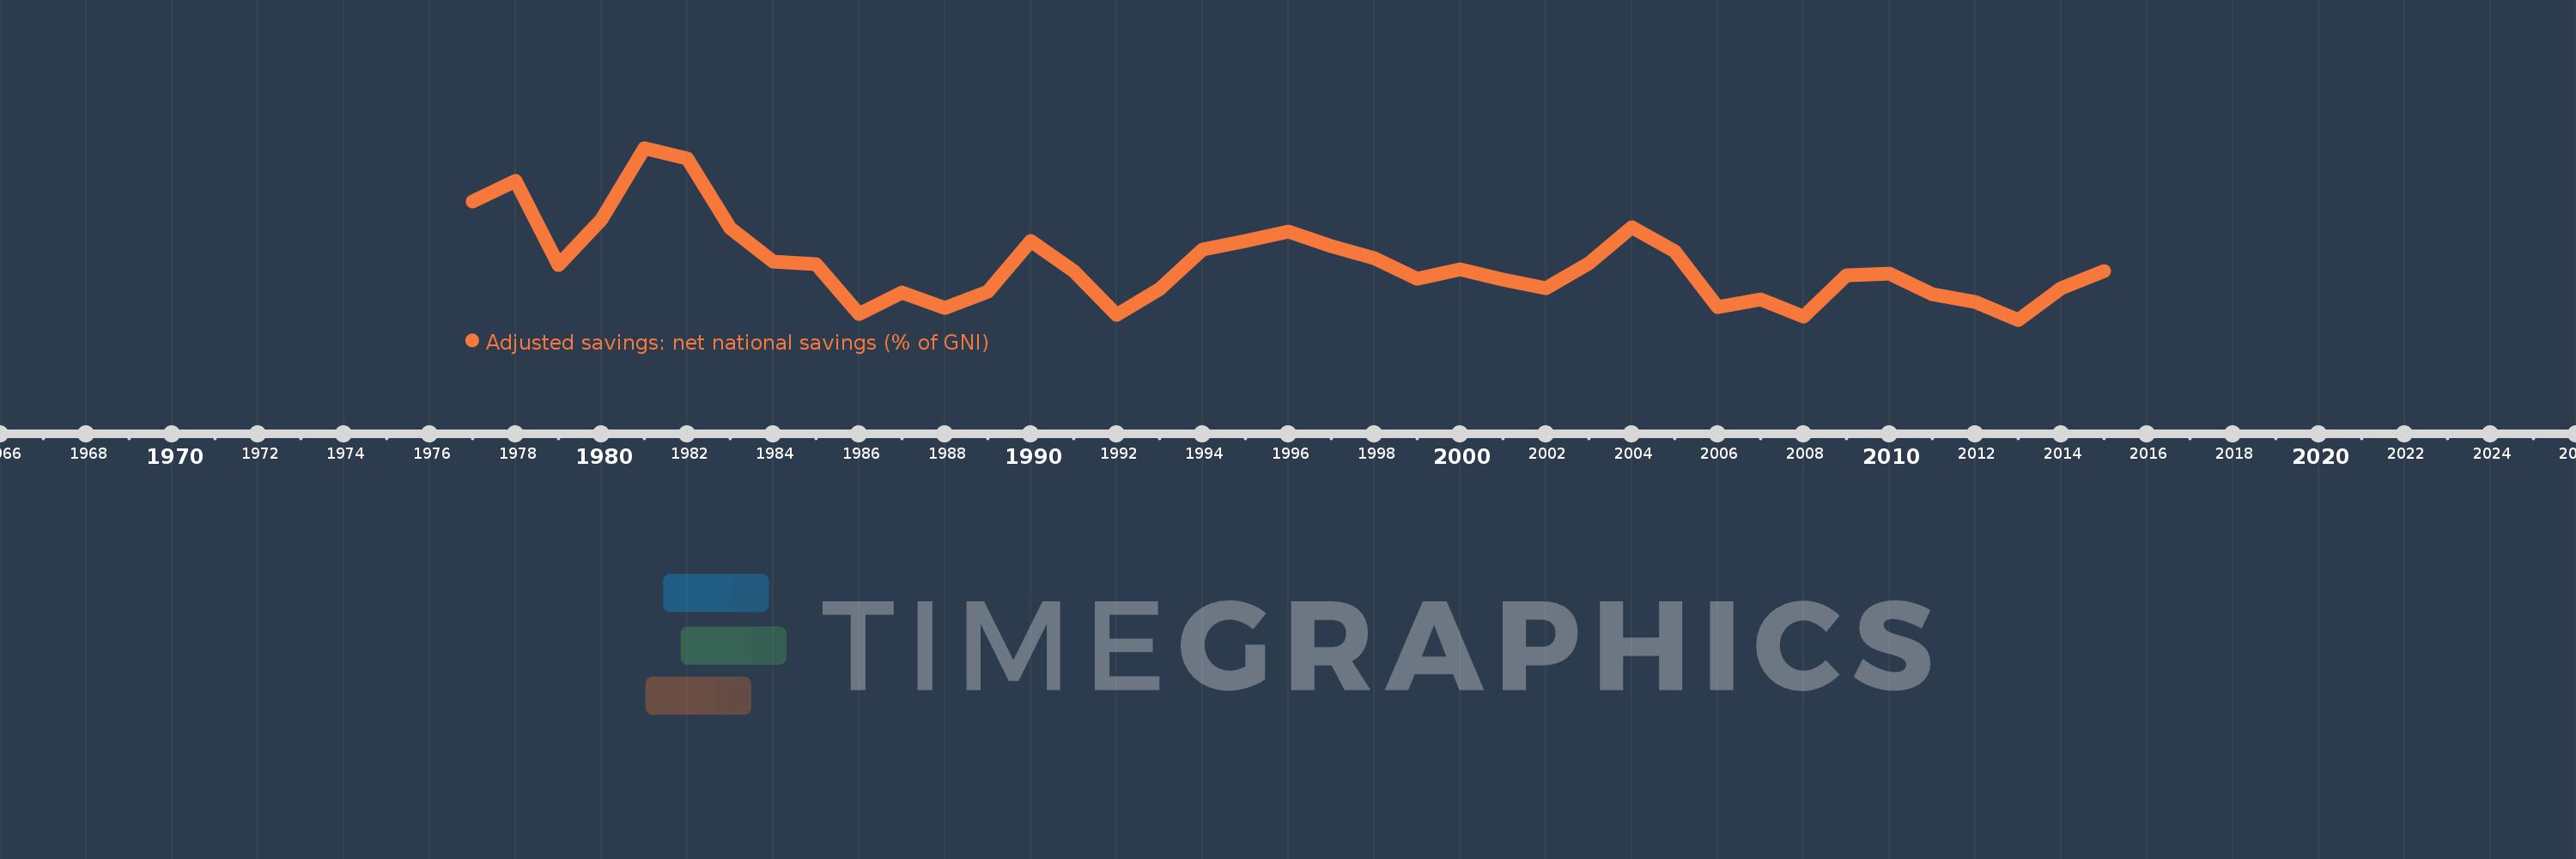
Adjusted savings: net national savings (% of GNI)
2015,2014,2013,2012,2011,2010,2009,2008,2007,2006,2005,2004,2003,2002,2001,2000,1999,1998,1997,1996,1995,1994,1993,1992,1991,1990,1989,1988,1987,1986,1985,1984,1983,1982,1981,1980,1979,1978,1977
This statistics in other country:
AfghanistanAlbaniaAlgeriaAngolaAntigua and BarbudaArab WorldArgentinaArmeniaAustraliaAustriaAzerbaijanBahamas, TheBahrainBangladeshBarbadosBelarusBelgiumBelizeBeninBermudaBhutanBoliviaBosnia and HerzegovinaBotswanaBrazilBrunei DarussalamBulgariaBurkina FasoBurundiCabo VerdeCambodiaCameroonCanadaCaribbean small statesCentral African RepublicCentral Europe and the BalticsChadChileChinaColombiaComorosCongo, Dem. Rep.Congo, Rep.Costa RicaCote d'IvoireCroatiaCyprusCzech RepublicDenmarkDjiboutiDominicaDominican RepublicEarly-demographic dividendEast Asia & PacificEast Asia & Pacific (excluding high income)East Asia & Pacific (IDA & IBRD countries)EcuadorEgypt, Arab Rep.El SalvadorEquatorial GuineaEritreaEstoniaEthiopiaEuro areaEurope & Central AsiaEurope & Central Asia (excluding high income)Europe & Central Asia (IDA & IBRD countries)European UnionFijiFinlandFragile and conflict affected situationsFranceGabonGambia, TheGeorgiaGermanyGhanaGreeceGrenadaGuatemalaGuineaGuinea-BissauGuyanaHaitiHeavily indebted poor countries (HIPC)High incomeHondurasHong Kong SAR, ChinaHungaryIBRD onlyIcelandIDA & IBRD totalIDA blendIDA onlyIDA totalIndiaIndonesiaIran, Islamic Rep.IraqIrelandIsraelItalyJamaicaJapanJordanKazakhstanKenyaKiribatiKorea, Rep.KosovoKuwaitKyrgyz RepublicLao PDRLate-demographic dividendLatin America & Caribbean Latin America & Caribbean (excluding high income)Latin America & the Caribbean (IDA & IBRD countries)LatviaLeast developed countries: UN classificationLebanonLesothoLiberiaLibyaLithuaniaLow & middle incomeLow incomeLower middle incomeLuxembourgMacao SAR, ChinaMacedonia, FYRMadagascarMalawiMalaysiaMaldivesMaliMaltaMauritaniaMauritiusMexicoMiddle East & North AfricaMiddle East & North Africa (excluding high income)Middle East & North Africa (IDA & IBRD countries)Middle incomeMoldovaMongoliaMontenegroMoroccoMozambiqueNamibiaNepalNetherlandsNew ZealandNicaraguaNigerNigeriaNorth AmericaNorwayOECD membersOmanOther small statesPacific island small statesPakistanPanamaPapua New GuineaParaguayPeruPhilippinesPolandPortugalPost-demographic dividendPre-demographic dividendQatarRomaniaRussian FederationRwandaSaudi ArabiaSenegalSerbiaSeychellesSierra LeoneSingaporeSlovak RepublicSloveniaSmall statesSolomon IslandsSouth AfricaSouth AsiaSouth Asia (IDA & IBRD)SpainSri LankaSt. Kitts and NevisSt. LuciaSt. Vincent and the GrenadinesSub-Saharan Africa Sub-Saharan Africa (excluding high income)Sub-Saharan Africa (IDA & IBRD countries)SudanSurinameSwazilandSwedenSwitzerlandSyrian Arab RepublicTajikistanTanzaniaThailandTimor-LesteTogoTongaTrinidad and TobagoTunisiaTurkeyTurkmenistanUgandaUkraineUnited KingdomUnited StatesUpper middle incomeUruguayVanuatuVenezuela, RBVietnamWest Bank and GazaWorldYemen, Rep.ZambiaZimbabwe Timeline:
This timeline shows a graph from 1977 to 2015 of Jordan. No data until 1976. Number of actual observations by date: 39.
Source name:
World Development Indicators
Source organization:
World Bank staff estimates based on sources and methods in World Bank's "The Changing Wealth of Nations: Measuring Sustainable Development in the New Millennium" (2011).
Categories, topics:
Economy & Growth, Environment
Last updated:
apr 23, 2017
Indicators value changes by year
Maximum:
37.606
jan 1, 1981
At the date of observation
Value
Absolute change
Change from previous value
jan 1, 1977
26.879
+26.879
0.0%
jan 1, 1978
30.94
+4.061
15.11%
jan 1, 1979
14.177
-16.764
-54.18%
jan 1, 1980
23.288
+9.112
64.27%
jan 1, 1981
37.606
+14.317
61.48%
jan 1, 1982
35.534
-2.071
-5.51%
jan 1, 1983
21.474
-14.06
-39.57%
jan 1, 1984
14.859
-6.615
-30.81%
jan 1, 1985
14.262
-0.597
-4.02%
jan 1, 1986
4.289
-9.973
-69.93%
jan 1, 1987
8.626
+4.337
101.12%
jan 1, 1988
5.479
-3.147
-36.48%
jan 1, 1989
8.746
+3.267
59.63%
jan 1, 1990
19.035
+10.288
117.63%
jan 1, 1991
12.886
-6.148
-32.3%
jan 1, 1992
4.236
-8.65
-67.13%
jan 1, 1993
9.392
+5.156
121.72%
jan 1, 1994
17.312
+7.92
84.33%
jan 1, 1995
18.905
+1.593
9.2%
jan 1, 1996
20.829
+1.923
10.17%
jan 1, 1997
18.004
-2.825
-13.56%
jan 1, 1998
15.599
-2.405
-13.36%
jan 1, 1999
11.453
-4.146
-26.58%
jan 1, 2000
13.355
+1.902
16.61%
jan 1, 2001
11.303
-2.052
-15.36%
jan 1, 2002
9.582
-1.721
-15.23%
jan 1, 2003
14.482
+4.9
51.14%
jan 1, 2004
21.697
+7.215
49.82%
jan 1, 2005
16.979
-4.719
-21.75%
jan 1, 2006
5.665
-11.314
-66.64%
jan 1, 2007
7.309
+1.644
29.02%
jan 1, 2008
3.773
-3.535
-48.37%
jan 1, 2009
12.055
+8.282
219.48%
jan 1, 2010
12.498
+0.443
3.67%
jan 1, 2011
8.324
-4.174
-33.4%
jan 1, 2012
6.767
-1.557
-18.71%
jan 1, 2013
3.207
-3.559
-52.6%
jan 1, 2014
9.434
+6.227
194.15%
jan 1, 2015
12.992
+3.558
37.71%
Ranking of countries by current statistics by years


Comments: