29
/
en
AIzaSyAYiBZKx7MnpbEhh9jyipgxe19OcubqV5w
April 1, 2024
37915
IDA blend
IDB
false
2
1
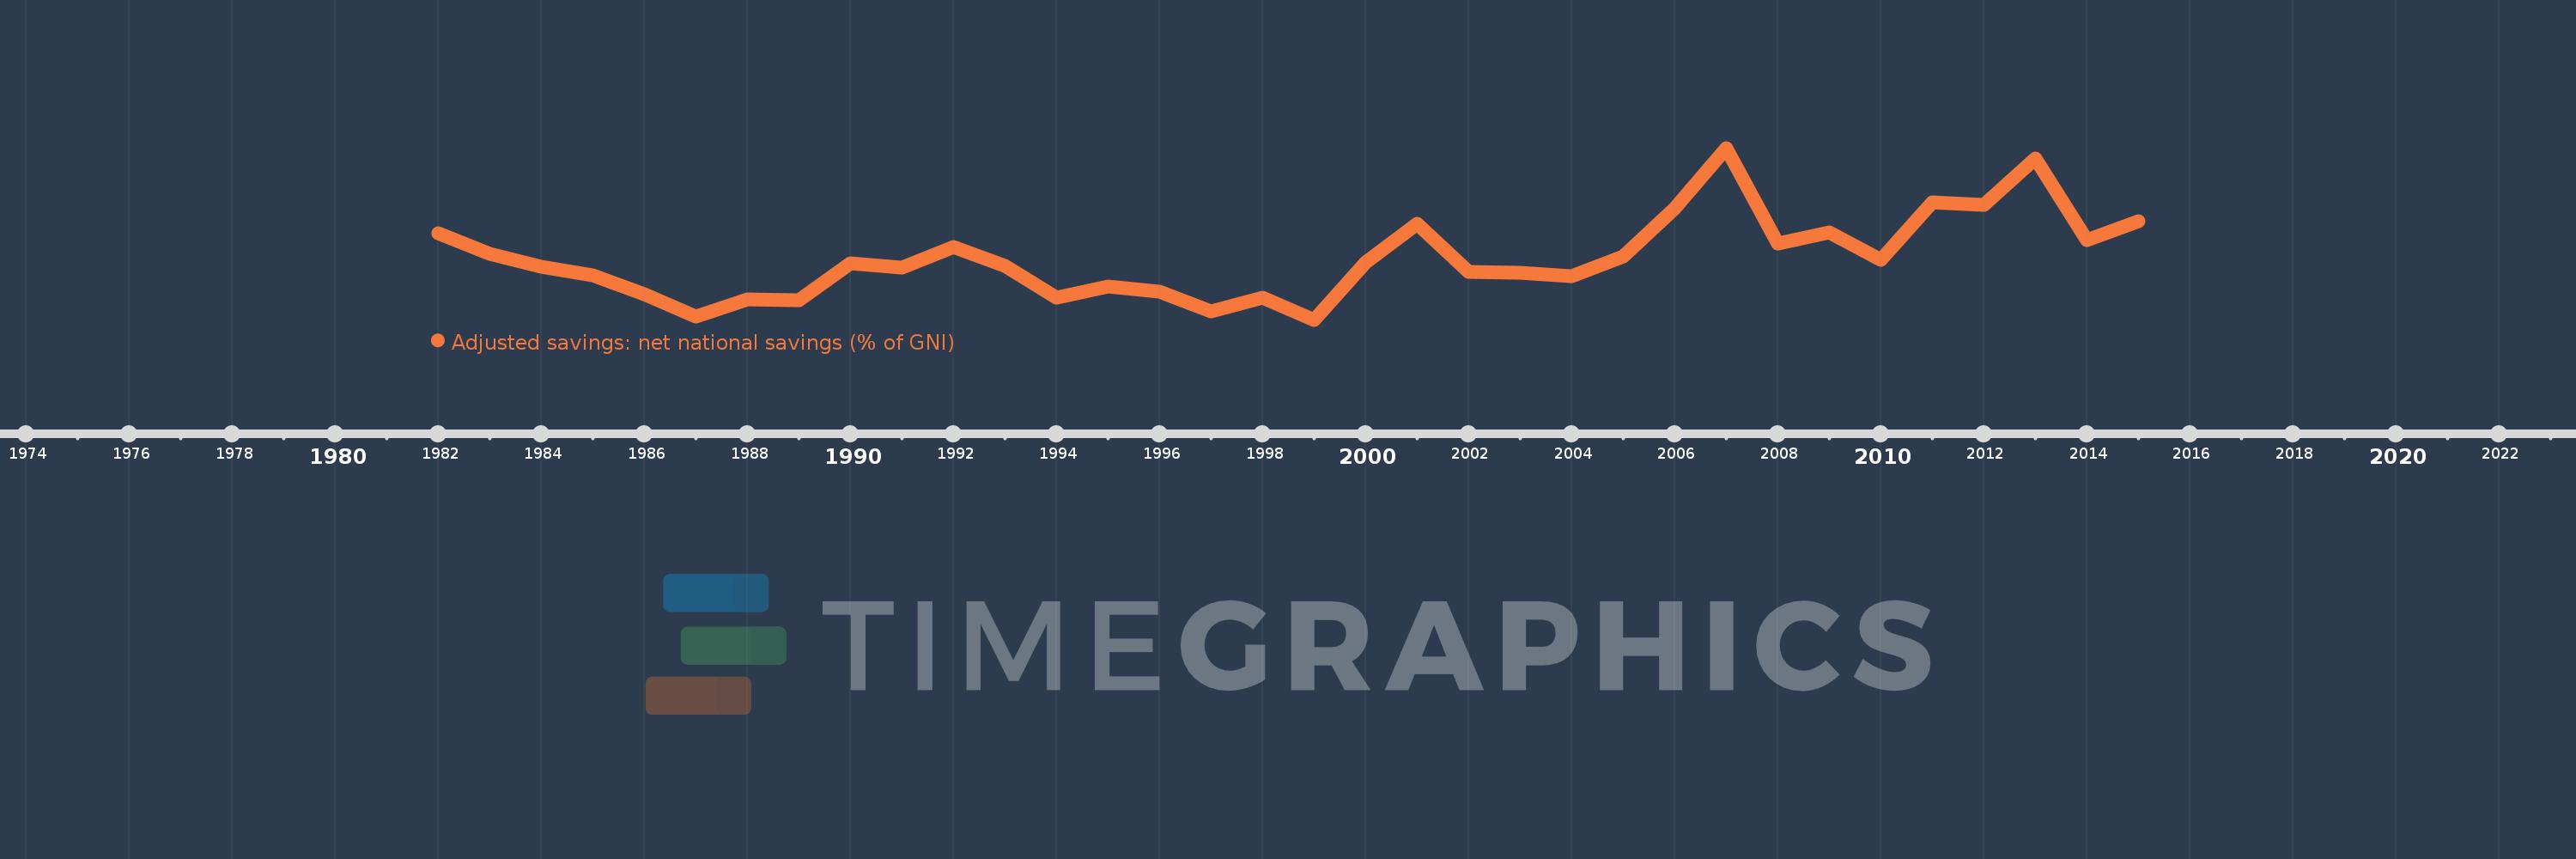
Adjusted savings: net national savings (% of GNI)
2015,2014,2013,2012,2011,2010,2009,2008,2007,2006,2005,2004,2003,2002,2001,2000,1999,1998,1997,1996,1995,1994,1993,1992,1991,1990,1989,1988,1987,1986,1985,1984,1983,1982
This statistics in other country:
AfghanistanAlbaniaAlgeriaAngolaAntigua and BarbudaArab WorldArgentinaArmeniaAustraliaAustriaAzerbaijanBahamas, TheBahrainBangladeshBarbadosBelarusBelgiumBelizeBeninBermudaBhutanBoliviaBosnia and HerzegovinaBotswanaBrazilBrunei DarussalamBulgariaBurkina FasoBurundiCabo VerdeCambodiaCameroonCanadaCaribbean small statesCentral African RepublicCentral Europe and the BalticsChadChileChinaColombiaComorosCongo, Dem. Rep.Congo, Rep.Costa RicaCote d'IvoireCroatiaCyprusCzech RepublicDenmarkDjiboutiDominicaDominican RepublicEarly-demographic dividendEast Asia & PacificEast Asia & Pacific (excluding high income)East Asia & Pacific (IDA & IBRD countries)EcuadorEgypt, Arab Rep.El SalvadorEquatorial GuineaEritreaEstoniaEthiopiaEuro areaEurope & Central AsiaEurope & Central Asia (excluding high income)Europe & Central Asia (IDA & IBRD countries)European UnionFijiFinlandFragile and conflict affected situationsFranceGabonGambia, TheGeorgiaGermanyGhanaGreeceGrenadaGuatemalaGuineaGuinea-BissauGuyanaHaitiHeavily indebted poor countries (HIPC)High incomeHondurasHong Kong SAR, ChinaHungaryIBRD onlyIcelandIDA & IBRD totalIDA blendIDA onlyIDA totalIndiaIndonesiaIran, Islamic Rep.IraqIrelandIsraelItalyJamaicaJapanJordanKazakhstanKenyaKiribatiKorea, Rep.KosovoKuwaitKyrgyz RepublicLao PDRLate-demographic dividendLatin America & Caribbean Latin America & Caribbean (excluding high income)Latin America & the Caribbean (IDA & IBRD countries)LatviaLeast developed countries: UN classificationLebanonLesothoLiberiaLibyaLithuaniaLow & middle incomeLow incomeLower middle incomeLuxembourgMacao SAR, ChinaMacedonia, FYRMadagascarMalawiMalaysiaMaldivesMaliMaltaMauritaniaMauritiusMexicoMiddle East & North AfricaMiddle East & North Africa (excluding high income)Middle East & North Africa (IDA & IBRD countries)Middle incomeMoldovaMongoliaMontenegroMoroccoMozambiqueNamibiaNepalNetherlandsNew ZealandNicaraguaNigerNigeriaNorth AmericaNorwayOECD membersOmanOther small statesPacific island small statesPakistanPanamaPapua New GuineaParaguayPeruPhilippinesPolandPortugalPost-demographic dividendPre-demographic dividendQatarRomaniaRussian FederationRwandaSaudi ArabiaSenegalSerbiaSeychellesSierra LeoneSingaporeSlovak RepublicSloveniaSmall statesSolomon IslandsSouth AfricaSouth AsiaSouth Asia (IDA & IBRD)SpainSri LankaSt. Kitts and NevisSt. LuciaSt. Vincent and the GrenadinesSub-Saharan Africa Sub-Saharan Africa (excluding high income)Sub-Saharan Africa (IDA & IBRD countries)SudanSurinameSwazilandSwedenSwitzerlandSyrian Arab RepublicTajikistanTanzaniaThailandTimor-LesteTogoTongaTrinidad and TobagoTunisiaTurkeyTurkmenistanUgandaUkraineUnited KingdomUnited StatesUpper middle incomeUruguayVanuatuVenezuela, RBVietnamWest Bank and GazaWorldYemen, Rep.ZambiaZimbabwe Timeline:
This timeline shows a graph from 1982 to 2015 of IDA blend. No data until 1981. Number of actual observations by date: 34.
Source name:
World Development Indicators
Source organization:
World Bank staff estimates based on sources and methods in World Bank's "The Changing Wealth of Nations: Measuring Sustainable Development in the New Millennium" (2011).
Categories, topics:
Economy & Growth, Environment
Last updated:
apr 23, 2017
Indicators value changes by year
Maximum:
23.278
jan 1, 2007
At the date of observation
Value
Absolute change
Change from previous value
jan 1, 1982
16.119
+16.119
0.0%
jan 1, 1983
14.35
-1.769
-10.97%
jan 1, 1984
13.282
-1.068
-7.45%
jan 1, 1985
12.588
-0.694
-5.22%
jan 1, 1986
10.976
-1.612
-12.81%
jan 1, 1987
9.112
-1.864
-16.98%
jan 1, 1988
10.574
+1.462
16.05%
jan 1, 1989
10.454
-0.12
-1.14%
jan 1, 1990
13.592
+3.138
30.02%
jan 1, 1991
13.216
-0.376
-2.77%
jan 1, 1992
14.955
+1.738
13.15%
jan 1, 1993
13.391
-1.563
-10.45%
jan 1, 1994
10.665
-2.726
-20.36%
jan 1, 1995
11.597
+0.932
8.74%
jan 1, 1996
11.2
-0.397
-3.42%
jan 1, 1997
9.523
-1.676
-14.97%
jan 1, 1998
10.66
+1.137
11.94%
jan 1, 1999
8.835
-1.825
-17.12%
jan 1, 2000
13.655
+4.82
54.55%
jan 1, 2001
16.879
+3.223
23.61%
jan 1, 2002
12.876
-4.003
-23.71%
jan 1, 2003
12.75
-0.126
-0.98%
jan 1, 2004
12.462
-0.288
-2.26%
jan 1, 2005
14.185
+1.723
13.83%
jan 1, 2006
18.199
+4.014
28.3%
jan 1, 2007
23.278
+5.079
27.91%
jan 1, 2008
15.22
-8.059
-34.62%
jan 1, 2009
16.215
+0.995
6.54%
jan 1, 2010
13.878
-2.337
-14.41%
jan 1, 2011
18.704
+4.826
34.78%
jan 1, 2012
18.49
-0.214
-1.15%
jan 1, 2013
22.425
+3.935
21.28%
jan 1, 2014
15.521
-6.903
-30.78%
jan 1, 2015
17.116
+1.594
10.27%
Ranking of countries by current statistics by years


Comments: