29
/
en
AIzaSyAYiBZKx7MnpbEhh9jyipgxe19OcubqV5w
April 1, 2024
56013
Small states
SST
false
2
1
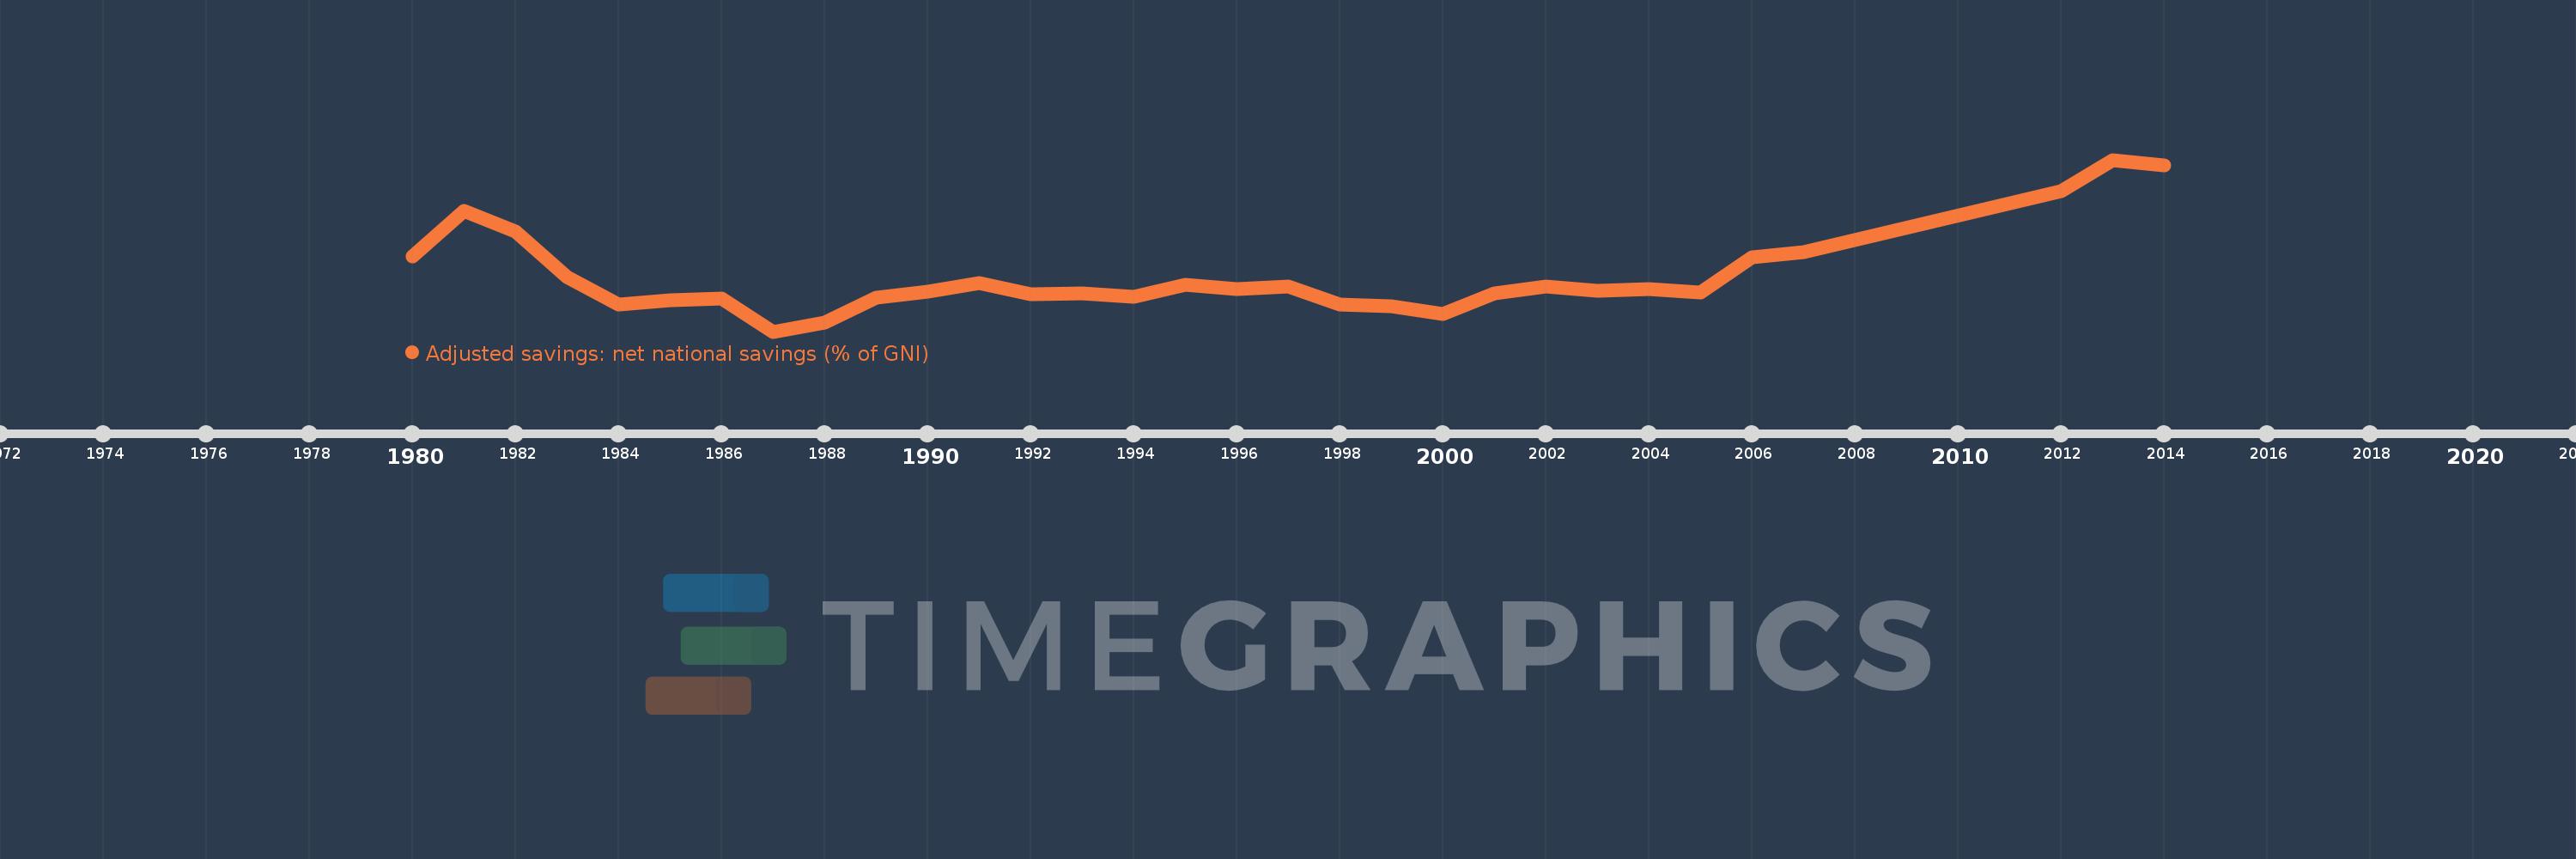
Adjusted savings: net national savings (% of GNI)
2014,2013,2012,2007,2006,2005,2004,2003,2002,2001,2000,1999,1998,1997,1996,1995,1994,1993,1992,1991,1990,1989,1988,1987,1986,1985,1984,1983,1982,1981,1980
This statistics in other country:
AfghanistanAlbaniaAlgeriaAngolaAntigua and BarbudaArab WorldArgentinaArmeniaAustraliaAustriaAzerbaijanBahamas, TheBahrainBangladeshBarbadosBelarusBelgiumBelizeBeninBermudaBhutanBoliviaBosnia and HerzegovinaBotswanaBrazilBrunei DarussalamBulgariaBurkina FasoBurundiCabo VerdeCambodiaCameroonCanadaCaribbean small statesCentral African RepublicCentral Europe and the BalticsChadChileChinaColombiaComorosCongo, Dem. Rep.Congo, Rep.Costa RicaCote d'IvoireCroatiaCyprusCzech RepublicDenmarkDjiboutiDominicaDominican RepublicEarly-demographic dividendEast Asia & PacificEast Asia & Pacific (excluding high income)East Asia & Pacific (IDA & IBRD countries)EcuadorEgypt, Arab Rep.El SalvadorEquatorial GuineaEritreaEstoniaEthiopiaEuro areaEurope & Central AsiaEurope & Central Asia (excluding high income)Europe & Central Asia (IDA & IBRD countries)European UnionFijiFinlandFragile and conflict affected situationsFranceGabonGambia, TheGeorgiaGermanyGhanaGreeceGrenadaGuatemalaGuineaGuinea-BissauGuyanaHaitiHeavily indebted poor countries (HIPC)High incomeHondurasHong Kong SAR, ChinaHungaryIBRD onlyIcelandIDA & IBRD totalIDA blendIDA onlyIDA totalIndiaIndonesiaIran, Islamic Rep.IraqIrelandIsraelItalyJamaicaJapanJordanKazakhstanKenyaKiribatiKorea, Rep.KosovoKuwaitKyrgyz RepublicLao PDRLate-demographic dividendLatin America & Caribbean Latin America & Caribbean (excluding high income)Latin America & the Caribbean (IDA & IBRD countries)LatviaLeast developed countries: UN classificationLebanonLesothoLiberiaLibyaLithuaniaLow & middle incomeLow incomeLower middle incomeLuxembourgMacao SAR, ChinaMacedonia, FYRMadagascarMalawiMalaysiaMaldivesMaliMaltaMauritaniaMauritiusMexicoMiddle East & North AfricaMiddle East & North Africa (excluding high income)Middle East & North Africa (IDA & IBRD countries)Middle incomeMoldovaMongoliaMontenegroMoroccoMozambiqueNamibiaNepalNetherlandsNew ZealandNicaraguaNigerNigeriaNorth AmericaNorwayOECD membersOmanOther small statesPacific island small statesPakistanPanamaPapua New GuineaParaguayPeruPhilippinesPolandPortugalPost-demographic dividendPre-demographic dividendQatarRomaniaRussian FederationRwandaSaudi ArabiaSenegalSerbiaSeychellesSierra LeoneSingaporeSlovak RepublicSloveniaSmall statesSolomon IslandsSouth AfricaSouth AsiaSouth Asia (IDA & IBRD)SpainSri LankaSt. Kitts and NevisSt. LuciaSt. Vincent and the GrenadinesSub-Saharan Africa Sub-Saharan Africa (excluding high income)Sub-Saharan Africa (IDA & IBRD countries)SudanSurinameSwazilandSwedenSwitzerlandSyrian Arab RepublicTajikistanTanzaniaThailandTimor-LesteTogoTongaTrinidad and TobagoTunisiaTurkeyTurkmenistanUgandaUkraineUnited KingdomUnited StatesUpper middle incomeUruguayVanuatuVenezuela, RBVietnamWest Bank and GazaWorldYemen, Rep.ZambiaZimbabwe Timeline:
This timeline shows a graph from 1980 to 2014 of Small states. No data until 1979. Number of actual observations by date: 31.
Source name:
World Development Indicators
Source organization:
World Bank staff estimates based on sources and methods in World Bank's "The Changing Wealth of Nations: Measuring Sustainable Development in the New Millennium" (2011).
Categories, topics:
Economy & Growth, Environment
Last updated:
apr 23, 2017
Indicators value changes by year
Maximum:
29.217
jan 1, 2013
At the date of observation
Value
Absolute change
Change from previous value
jan 1, 1980
17.156
+17.156
0.0%
jan 1, 1981
22.792
+5.636
32.85%
jan 1, 1982
20.262
-2.531
-11.1%
jan 1, 1983
14.55
-5.712
-28.19%
jan 1, 1984
11.111
-3.439
-23.64%
jan 1, 1985
11.644
+0.534
4.8%
jan 1, 1986
11.898
+0.254
2.18%
jan 1, 1987
7.786
-4.112
-34.56%
jan 1, 1988
8.897
+1.111
14.26%
jan 1, 1989
11.988
+3.091
34.75%
jan 1, 1990
12.768
+0.781
6.51%
jan 1, 1991
13.857
+1.088
8.52%
jan 1, 1992
12.498
-1.359
-9.81%
jan 1, 1993
12.58
+0.082
0.66%
jan 1, 1994
12.157
-0.423
-3.36%
jan 1, 1995
13.618
+1.461
12.02%
jan 1, 1996
13.046
-0.572
-4.2%
jan 1, 1997
13.365
+0.319
2.45%
jan 1, 1998
11.205
-2.161
-16.17%
jan 1, 1999
10.916
-0.289
-2.58%
jan 1, 2000
10.029
-0.887
-8.12%
jan 1, 2001
12.589
+2.559
25.52%
jan 1, 2002
13.441
+0.852
6.77%
jan 1, 2003
12.831
-0.61
-4.54%
jan 1, 2004
13.099
+0.268
2.09%
jan 1, 2005
12.638
-0.461
-3.52%
jan 1, 2006
17.089
+4.451
35.21%
jan 1, 2007
17.717
+0.628
3.67%
jan 1, 2012
25.293
+7.577
42.77%
jan 1, 2013
29.217
+3.924
15.51%
jan 1, 2014
28.558
-0.659
-2.25%
Ranking of countries by current statistics by years


Comments: