29
/
en
AIzaSyAYiBZKx7MnpbEhh9jyipgxe19OcubqV5w
April 1, 2024
58690
Sub-Saharan Africa
SSF
false
2
1
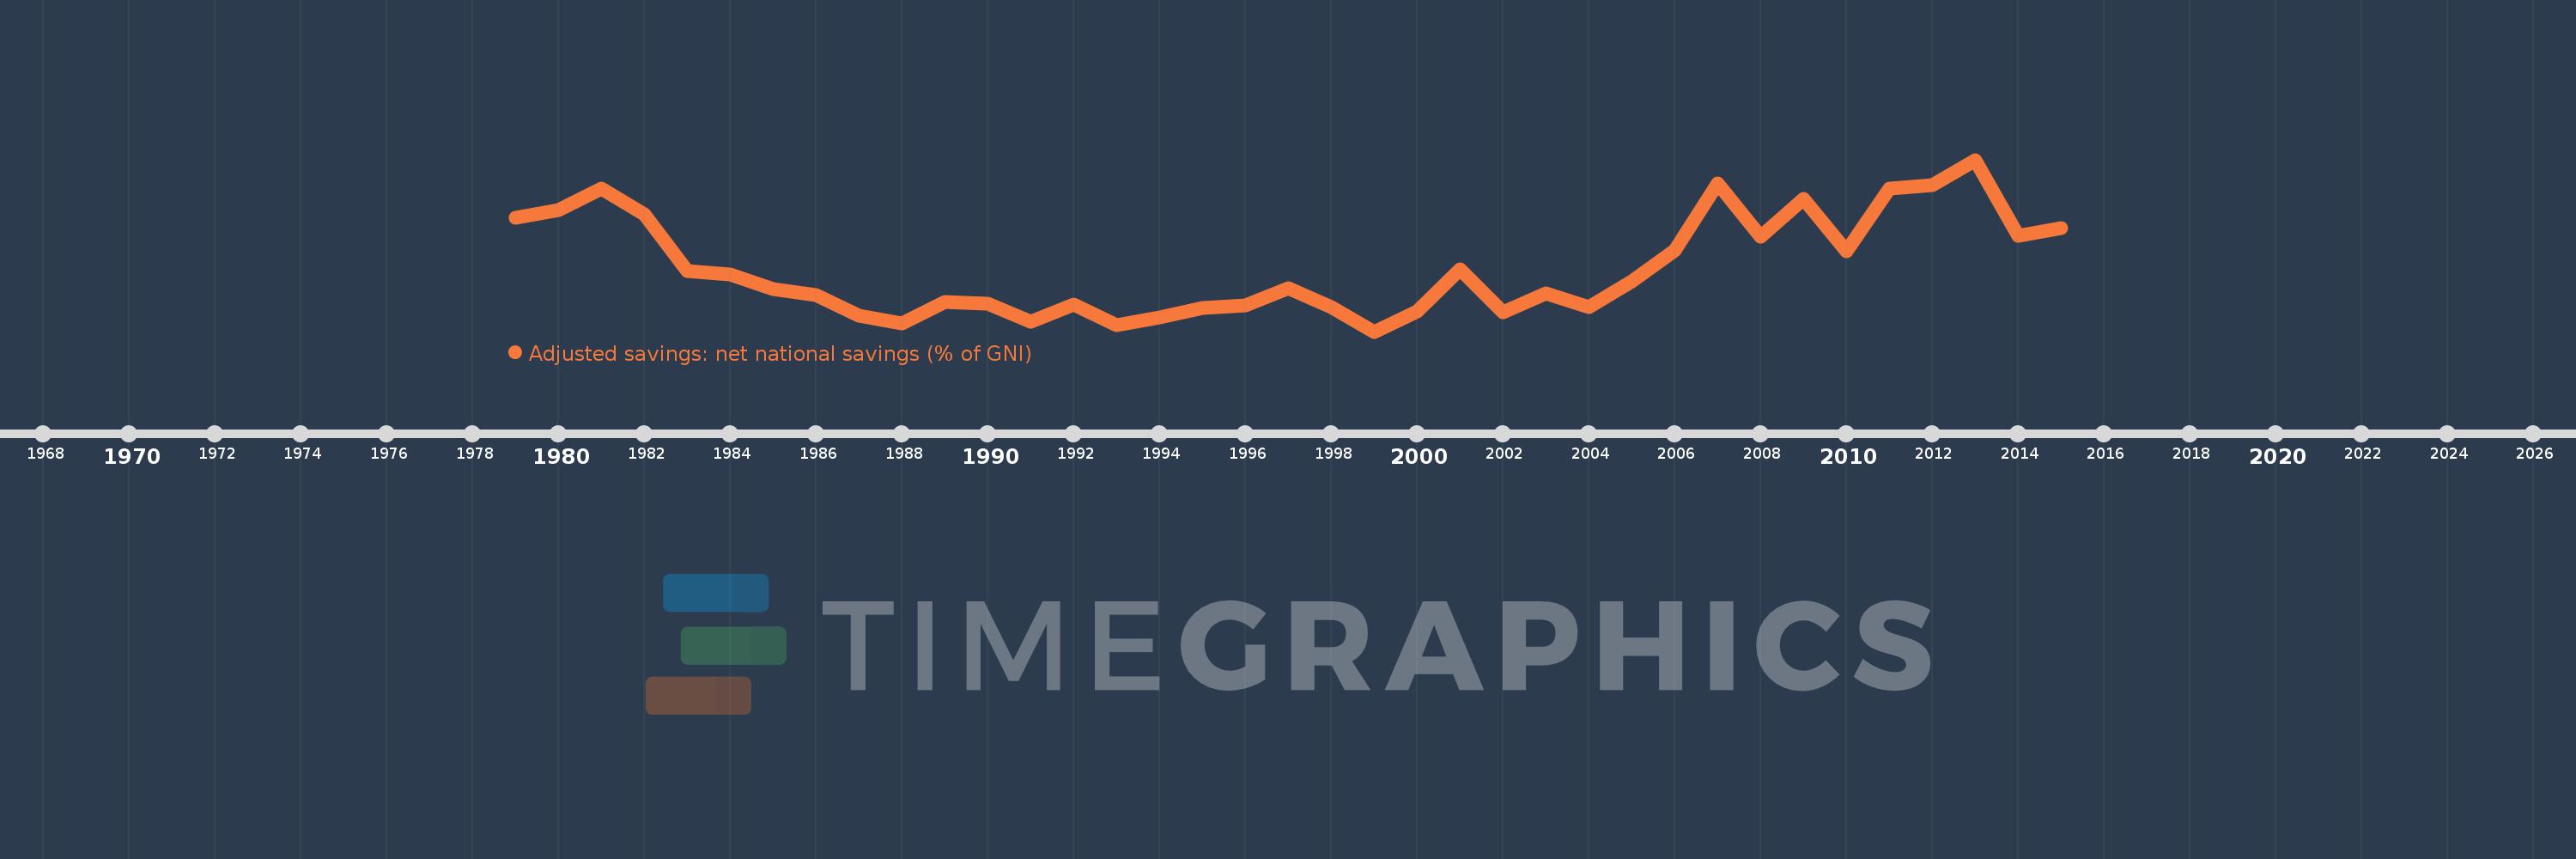
Adjusted savings: net national savings (% of GNI)
2015,2014,2013,2012,2011,2010,2009,2008,2007,2006,2005,2004,2003,2002,2001,2000,1999,1998,1997,1996,1995,1994,1993,1992,1991,1990,1989,1988,1987,1986,1985,1984,1983,1982,1981,1980,1979
This statistics in other country:
AfghanistanAlbaniaAlgeriaAngolaAntigua and BarbudaArab WorldArgentinaArmeniaAustraliaAustriaAzerbaijanBahamas, TheBahrainBangladeshBarbadosBelarusBelgiumBelizeBeninBermudaBhutanBoliviaBosnia and HerzegovinaBotswanaBrazilBrunei DarussalamBulgariaBurkina FasoBurundiCabo VerdeCambodiaCameroonCanadaCaribbean small statesCentral African RepublicCentral Europe and the BalticsChadChileChinaColombiaComorosCongo, Dem. Rep.Congo, Rep.Costa RicaCote d'IvoireCroatiaCyprusCzech RepublicDenmarkDjiboutiDominicaDominican RepublicEarly-demographic dividendEast Asia & PacificEast Asia & Pacific (excluding high income)East Asia & Pacific (IDA & IBRD countries)EcuadorEgypt, Arab Rep.El SalvadorEquatorial GuineaEritreaEstoniaEthiopiaEuro areaEurope & Central AsiaEurope & Central Asia (excluding high income)Europe & Central Asia (IDA & IBRD countries)European UnionFijiFinlandFragile and conflict affected situationsFranceGabonGambia, TheGeorgiaGermanyGhanaGreeceGrenadaGuatemalaGuineaGuinea-BissauGuyanaHaitiHeavily indebted poor countries (HIPC)High incomeHondurasHong Kong SAR, ChinaHungaryIBRD onlyIcelandIDA & IBRD totalIDA blendIDA onlyIDA totalIndiaIndonesiaIran, Islamic Rep.IraqIrelandIsraelItalyJamaicaJapanJordanKazakhstanKenyaKiribatiKorea, Rep.KosovoKuwaitKyrgyz RepublicLao PDRLate-demographic dividendLatin America & Caribbean Latin America & Caribbean (excluding high income)Latin America & the Caribbean (IDA & IBRD countries)LatviaLeast developed countries: UN classificationLebanonLesothoLiberiaLibyaLithuaniaLow & middle incomeLow incomeLower middle incomeLuxembourgMacao SAR, ChinaMacedonia, FYRMadagascarMalawiMalaysiaMaldivesMaliMaltaMauritaniaMauritiusMexicoMiddle East & North AfricaMiddle East & North Africa (excluding high income)Middle East & North Africa (IDA & IBRD countries)Middle incomeMoldovaMongoliaMontenegroMoroccoMozambiqueNamibiaNepalNetherlandsNew ZealandNicaraguaNigerNigeriaNorth AmericaNorwayOECD membersOmanOther small statesPacific island small statesPakistanPanamaPapua New GuineaParaguayPeruPhilippinesPolandPortugalPost-demographic dividendPre-demographic dividendQatarRomaniaRussian FederationRwandaSaudi ArabiaSenegalSerbiaSeychellesSierra LeoneSingaporeSlovak RepublicSloveniaSmall statesSolomon IslandsSouth AfricaSouth AsiaSouth Asia (IDA & IBRD)SpainSri LankaSt. Kitts and NevisSt. LuciaSt. Vincent and the GrenadinesSub-Saharan Africa Sub-Saharan Africa (excluding high income)Sub-Saharan Africa (IDA & IBRD countries)SudanSurinameSwazilandSwedenSwitzerlandSyrian Arab RepublicTajikistanTanzaniaThailandTimor-LesteTogoTongaTrinidad and TobagoTunisiaTurkeyTurkmenistanUgandaUkraineUnited KingdomUnited StatesUpper middle incomeUruguayVanuatuVenezuela, RBVietnamWest Bank and GazaWorldYemen, Rep.ZambiaZimbabwe Timeline:
This timeline shows a graph from 1979 to 2015 of Sub-Saharan Africa . No data until 1978. Number of actual observations by date: 37.
Source name:
World Development Indicators
Source organization:
World Bank staff estimates based on sources and methods in World Bank's "The Changing Wealth of Nations: Measuring Sustainable Development in the New Millennium" (2011).
Categories, topics:
Economy & Growth, Environment
Last updated:
apr 23, 2017
Indicators value changes by year
At the date of observation
Value
Absolute change
Change from previous value
jan 1, 1979
11.538
+11.538
0.0%
jan 1, 1980
12.105
+0.567
4.91%
jan 1, 1981
13.724
+1.619
13.37%
jan 1, 1982
11.801
-1.923
-14.01%
jan 1, 1983
7.616
-4.185
-35.47%
jan 1, 1984
7.381
-0.235
-3.08%
jan 1, 1985
6.243
-1.138
-15.42%
jan 1, 1986
5.85
-0.393
-6.3%
jan 1, 1987
4.278
-1.572
-26.88%
jan 1, 1988
3.724
-0.554
-12.94%
jan 1, 1989
5.288
+1.564
42.0%
jan 1, 1990
5.181
-0.107
-2.03%
jan 1, 1991
3.838
-1.343
-25.92%
jan 1, 1992
5.14
+1.302
33.92%
jan 1, 1993
3.567
-1.573
-30.6%
jan 1, 1994
4.201
+0.634
17.78%
jan 1, 1995
4.892
+0.691
16.45%
jan 1, 1996
5.071
+0.179
3.65%
jan 1, 1997
6.345
+1.274
25.13%
jan 1, 1998
4.922
-1.423
-22.43%
jan 1, 1999
3.119
-1.803
-36.63%
jan 1, 2000
4.614
+1.495
47.92%
jan 1, 2001
7.754
+3.141
68.08%
jan 1, 2002
4.525
-3.23
-41.65%
jan 1, 2003
5.936
+1.411
31.19%
jan 1, 2004
4.91
-1.026
-17.29%
jan 1, 2005
6.853
+1.944
39.59%
jan 1, 2006
9.168
+2.315
33.78%
jan 1, 2007
14.094
+4.925
53.72%
jan 1, 2008
10.157
-3.936
-27.93%
jan 1, 2009
12.953
+2.795
27.52%
jan 1, 2010
9.074
-3.879
-29.94%
jan 1, 2011
13.705
+4.63
51.03%
jan 1, 2012
14.006
+0.301
2.2%
jan 1, 2013
15.86
+1.854
13.24%
jan 1, 2014
10.194
-5.665
-35.72%
jan 1, 2015
10.81
+0.616
6.04%
Ranking of countries by current statistics by years


Comments: