29
/
en
AIzaSyAYiBZKx7MnpbEhh9jyipgxe19OcubqV5w
April 1, 2024
64274
Albania
ALB
true
2
1
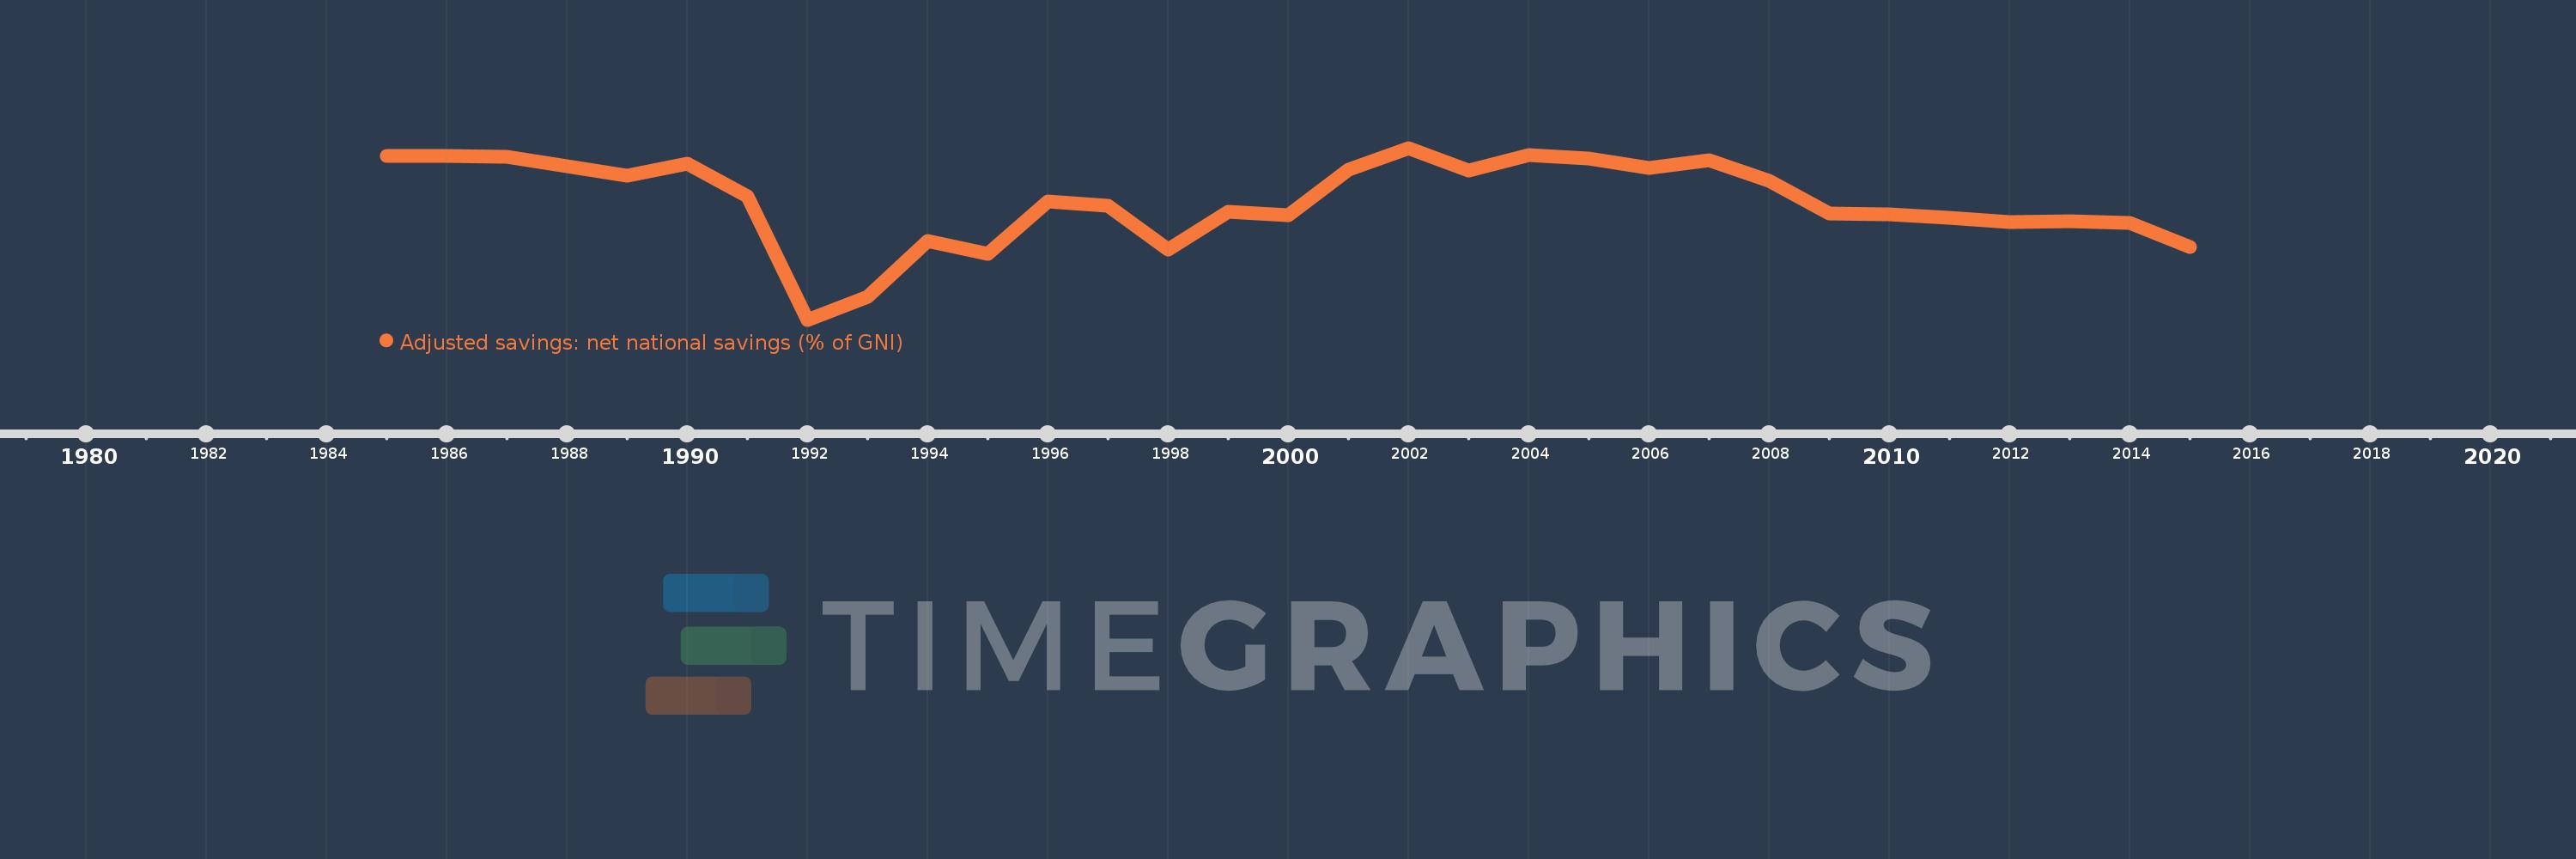
Adjusted savings: net national savings (% of GNI)
2015,2014,2013,2012,2011,2010,2009,2008,2007,2006,2005,2004,2003,2002,2001,2000,1999,1998,1997,1996,1995,1994,1993,1992,1991,1990,1989,1988,1987,1986,1985
This statistics in other country:
AfghanistanAlbaniaAlgeriaAngolaAntigua and BarbudaArab WorldArgentinaArmeniaAustraliaAustriaAzerbaijanBahamas, TheBahrainBangladeshBarbadosBelarusBelgiumBelizeBeninBermudaBhutanBoliviaBosnia and HerzegovinaBotswanaBrazilBrunei DarussalamBulgariaBurkina FasoBurundiCabo VerdeCambodiaCameroonCanadaCaribbean small statesCentral African RepublicCentral Europe and the BalticsChadChileChinaColombiaComorosCongo, Dem. Rep.Congo, Rep.Costa RicaCote d'IvoireCroatiaCyprusCzech RepublicDenmarkDjiboutiDominicaDominican RepublicEarly-demographic dividendEast Asia & PacificEast Asia & Pacific (excluding high income)East Asia & Pacific (IDA & IBRD countries)EcuadorEgypt, Arab Rep.El SalvadorEquatorial GuineaEritreaEstoniaEthiopiaEuro areaEurope & Central AsiaEurope & Central Asia (excluding high income)Europe & Central Asia (IDA & IBRD countries)European UnionFijiFinlandFragile and conflict affected situationsFranceGabonGambia, TheGeorgiaGermanyGhanaGreeceGrenadaGuatemalaGuineaGuinea-BissauGuyanaHaitiHeavily indebted poor countries (HIPC)High incomeHondurasHong Kong SAR, ChinaHungaryIBRD onlyIcelandIDA & IBRD totalIDA blendIDA onlyIDA totalIndiaIndonesiaIran, Islamic Rep.IraqIrelandIsraelItalyJamaicaJapanJordanKazakhstanKenyaKiribatiKorea, Rep.KosovoKuwaitKyrgyz RepublicLao PDRLate-demographic dividendLatin America & Caribbean Latin America & Caribbean (excluding high income)Latin America & the Caribbean (IDA & IBRD countries)LatviaLeast developed countries: UN classificationLebanonLesothoLiberiaLibyaLithuaniaLow & middle incomeLow incomeLower middle incomeLuxembourgMacao SAR, ChinaMacedonia, FYRMadagascarMalawiMalaysiaMaldivesMaliMaltaMauritaniaMauritiusMexicoMiddle East & North AfricaMiddle East & North Africa (excluding high income)Middle East & North Africa (IDA & IBRD countries)Middle incomeMoldovaMongoliaMontenegroMoroccoMozambiqueNamibiaNepalNetherlandsNew ZealandNicaraguaNigerNigeriaNorth AmericaNorwayOECD membersOmanOther small statesPacific island small statesPakistanPanamaPapua New GuineaParaguayPeruPhilippinesPolandPortugalPost-demographic dividendPre-demographic dividendQatarRomaniaRussian FederationRwandaSaudi ArabiaSenegalSerbiaSeychellesSierra LeoneSingaporeSlovak RepublicSloveniaSmall statesSolomon IslandsSouth AfricaSouth AsiaSouth Asia (IDA & IBRD)SpainSri LankaSt. Kitts and NevisSt. LuciaSt. Vincent and the GrenadinesSub-Saharan Africa Sub-Saharan Africa (excluding high income)Sub-Saharan Africa (IDA & IBRD countries)SudanSurinameSwazilandSwedenSwitzerlandSyrian Arab RepublicTajikistanTanzaniaThailandTimor-LesteTogoTongaTrinidad and TobagoTunisiaTurkeyTurkmenistanUgandaUkraineUnited KingdomUnited StatesUpper middle incomeUruguayVanuatuVenezuela, RBVietnamWest Bank and GazaWorldYemen, Rep.ZambiaZimbabwe Timeline:
This timeline shows a graph from 1985 to 2015 of Albania. No data until 1984. Number of actual observations by date: 31.
Source name:
World Development Indicators
Source organization:
World Bank staff estimates based on sources and methods in World Bank's "The Changing Wealth of Nations: Measuring Sustainable Development in the New Millennium" (2011).
Categories, topics:
Economy & Growth, Environment
Last updated:
apr 23, 2017
Indicators value changes by year
Minimum:
-16.566
jan 1, 1992
Maximum:
22.983
jan 1, 2002
At the date of observation
Value
Absolute change
Change from previous value
jan 1, 1985
21.059
+21.059
0.0%
jan 1, 1986
21.134
+0.076
0.36%
jan 1, 1987
20.934
-0.2
-0.95%
jan 1, 1988
18.842
-2.092
-9.99%
jan 1, 1989
16.592
-2.25
-11.94%
jan 1, 1990
19.455
+2.862
17.25%
jan 1, 1991
11.946
-7.509
-38.59%
jan 1, 1992
-16.566
-28.512
-238.67%
jan 1, 1993
-11.285
+5.281
-31.88%
jan 1, 1994
1.633
+12.918
-114.47%
jan 1, 1995
-1.329
-2.962
-181.36%
jan 1, 1996
10.718
+12.047
-906.58%
jan 1, 1997
9.656
-1.062
-9.91%
jan 1, 1998
-0.33
-9.986
-103.41%
jan 1, 1999
8.274
+8.604
-2.61K%
jan 1, 2000
7.581
-0.693
-8.38%
jan 1, 2001
17.922
+10.341
136.41%
jan 1, 2002
22.983
+5.061
28.24%
jan 1, 2003
17.875
-5.108
-22.23%
jan 1, 2004
21.284
+3.409
19.07%
jan 1, 2005
20.454
-0.83
-3.9%
jan 1, 2006
18.385
-2.069
-10.12%
jan 1, 2007
20.162
+1.777
9.67%
jan 1, 2008
15.482
-4.68
-23.21%
jan 1, 2009
7.896
-7.586
-49.0%
jan 1, 2010
7.638
-0.258
-3.27%
jan 1, 2011
6.833
-0.805
-10.54%
jan 1, 2012
5.907
-0.926
-13.55%
jan 1, 2013
6.182
+0.274
4.64%
jan 1, 2014
5.774
-0.408
-6.6%
jan 1, 2015
0.158
-5.615
-97.26%
Ranking of countries by current statistics by years


Comments: