29
/
en
AIzaSyAYiBZKx7MnpbEhh9jyipgxe19OcubqV5w
April 1, 2024
47897
Middle East & North Africa
MEA
false
2
1
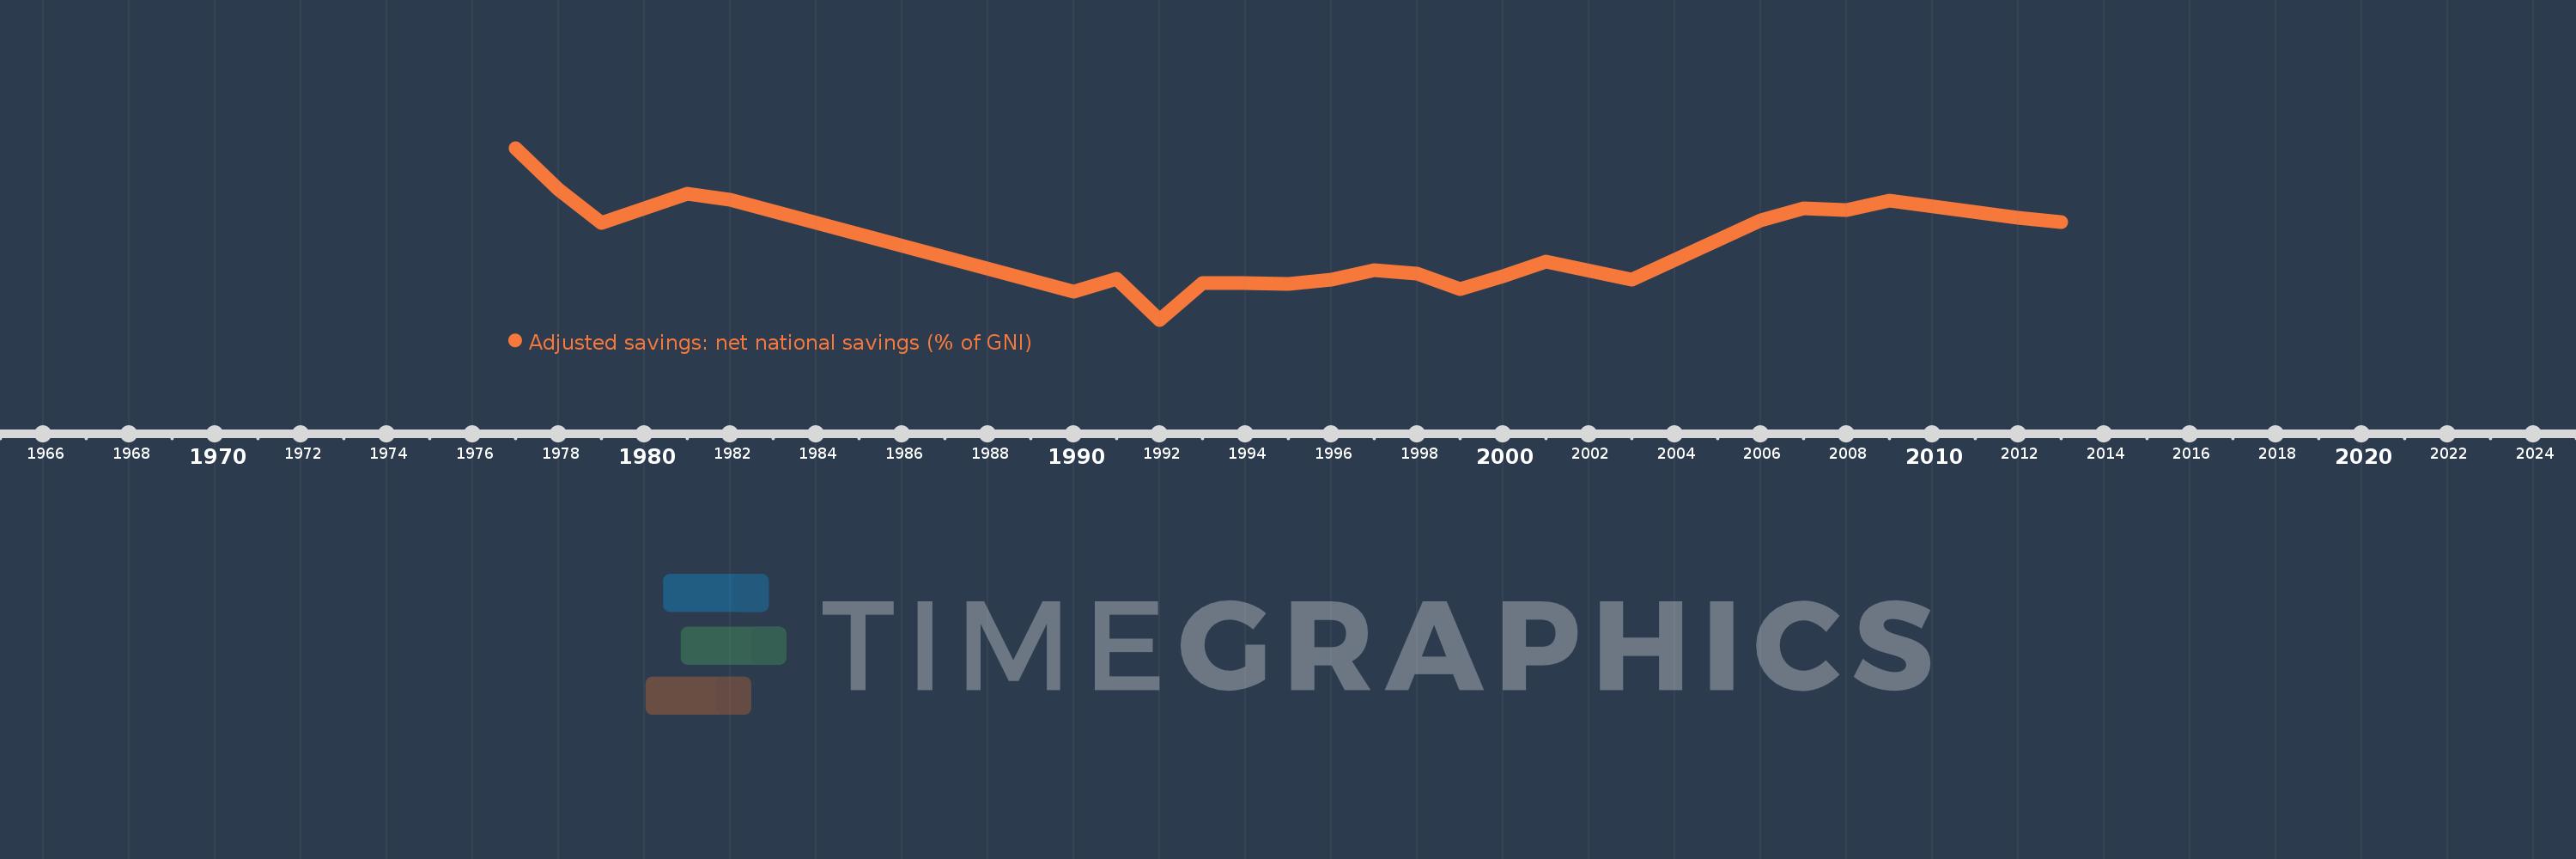
Adjusted savings: net national savings (% of GNI)
2013,2012,2009,2008,2007,2006,2003,2001,2000,1999,1998,1997,1996,1995,1994,1993,1992,1991,1990,1982,1981,1980,1979,1978,1977
This statistics in other country:
AfghanistanAlbaniaAlgeriaAngolaAntigua and BarbudaArab WorldArgentinaArmeniaAustraliaAustriaAzerbaijanBahamas, TheBahrainBangladeshBarbadosBelarusBelgiumBelizeBeninBermudaBhutanBoliviaBosnia and HerzegovinaBotswanaBrazilBrunei DarussalamBulgariaBurkina FasoBurundiCabo VerdeCambodiaCameroonCanadaCaribbean small statesCentral African RepublicCentral Europe and the BalticsChadChileChinaColombiaComorosCongo, Dem. Rep.Congo, Rep.Costa RicaCote d'IvoireCroatiaCyprusCzech RepublicDenmarkDjiboutiDominicaDominican RepublicEarly-demographic dividendEast Asia & PacificEast Asia & Pacific (excluding high income)East Asia & Pacific (IDA & IBRD countries)EcuadorEgypt, Arab Rep.El SalvadorEquatorial GuineaEritreaEstoniaEthiopiaEuro areaEurope & Central AsiaEurope & Central Asia (excluding high income)Europe & Central Asia (IDA & IBRD countries)European UnionFijiFinlandFragile and conflict affected situationsFranceGabonGambia, TheGeorgiaGermanyGhanaGreeceGrenadaGuatemalaGuineaGuinea-BissauGuyanaHaitiHeavily indebted poor countries (HIPC)High incomeHondurasHong Kong SAR, ChinaHungaryIBRD onlyIcelandIDA & IBRD totalIDA blendIDA onlyIDA totalIndiaIndonesiaIran, Islamic Rep.IraqIrelandIsraelItalyJamaicaJapanJordanKazakhstanKenyaKiribatiKorea, Rep.KosovoKuwaitKyrgyz RepublicLao PDRLate-demographic dividendLatin America & Caribbean Latin America & Caribbean (excluding high income)Latin America & the Caribbean (IDA & IBRD countries)LatviaLeast developed countries: UN classificationLebanonLesothoLiberiaLibyaLithuaniaLow & middle incomeLow incomeLower middle incomeLuxembourgMacao SAR, ChinaMacedonia, FYRMadagascarMalawiMalaysiaMaldivesMaliMaltaMauritaniaMauritiusMexicoMiddle East & North AfricaMiddle East & North Africa (excluding high income)Middle East & North Africa (IDA & IBRD countries)Middle incomeMoldovaMongoliaMontenegroMoroccoMozambiqueNamibiaNepalNetherlandsNew ZealandNicaraguaNigerNigeriaNorth AmericaNorwayOECD membersOmanOther small statesPacific island small statesPakistanPanamaPapua New GuineaParaguayPeruPhilippinesPolandPortugalPost-demographic dividendPre-demographic dividendQatarRomaniaRussian FederationRwandaSaudi ArabiaSenegalSerbiaSeychellesSierra LeoneSingaporeSlovak RepublicSloveniaSmall statesSolomon IslandsSouth AfricaSouth AsiaSouth Asia (IDA & IBRD)SpainSri LankaSt. Kitts and NevisSt. LuciaSt. Vincent and the GrenadinesSub-Saharan Africa Sub-Saharan Africa (excluding high income)Sub-Saharan Africa (IDA & IBRD countries)SudanSurinameSwazilandSwedenSwitzerlandSyrian Arab RepublicTajikistanTanzaniaThailandTimor-LesteTogoTongaTrinidad and TobagoTunisiaTurkeyTurkmenistanUgandaUkraineUnited KingdomUnited StatesUpper middle incomeUruguayVanuatuVenezuela, RBVietnamWest Bank and GazaWorldYemen, Rep.ZambiaZimbabwe Timeline:
This timeline shows a graph from 1977 to 2013 of Middle East & North Africa. No data until 1976. Number of actual observations by date: 25.
Source name:
World Development Indicators
Source organization:
World Bank staff estimates based on sources and methods in World Bank's "The Changing Wealth of Nations: Measuring Sustainable Development in the New Millennium" (2011).
Categories, topics:
Economy & Growth, Environment
Last updated:
apr 23, 2017
Indicators value changes by year
Maximum:
46.572
jan 1, 1977
At the date of observation
Value
Absolute change
Change from previous value
jan 1, 1977
46.572
+46.572
0.0%
jan 1, 1978
35.864
-10.708
-22.99%
jan 1, 1979
27.124
-8.74
-24.37%
jan 1, 1980
30.9
+3.776
13.92%
jan 1, 1981
34.69
+3.789
12.26%
jan 1, 1982
33.039
-1.65
-4.76%
jan 1, 1990
9.318
-23.722
-71.8%
jan 1, 1991
12.758
+3.44
36.92%
jan 1, 1992
2.035
-10.722
-84.05%
jan 1, 1993
11.459
+9.423
462.98%
jan 1, 1994
11.509
+0.05
0.44%
jan 1, 1995
11.26
-0.249
-2.17%
jan 1, 1996
12.437
+1.177
10.46%
jan 1, 1997
14.855
+2.418
19.44%
jan 1, 1998
14.076
-0.779
-5.24%
jan 1, 1999
9.903
-4.174
-29.65%
jan 1, 2000
13.376
+3.474
35.08%
jan 1, 2001
17.117
+3.741
27.97%
jan 1, 2003
12.467
-4.651
-27.17%
jan 1, 2006
27.807
+15.34
123.05%
jan 1, 2007
30.895
+3.088
11.1%
jan 1, 2008
30.461
-0.433
-1.4%
jan 1, 2009
32.949
+2.488
8.17%
jan 1, 2012
28.44
-4.509
-13.68%
jan 1, 2013
27.428
-1.012
-3.56%
Ranking of countries by current statistics by years


Comments: