29
/
en
AIzaSyAYiBZKx7MnpbEhh9jyipgxe19OcubqV5w
April 1, 2024
277307
Uruguay
URY
true
2
1
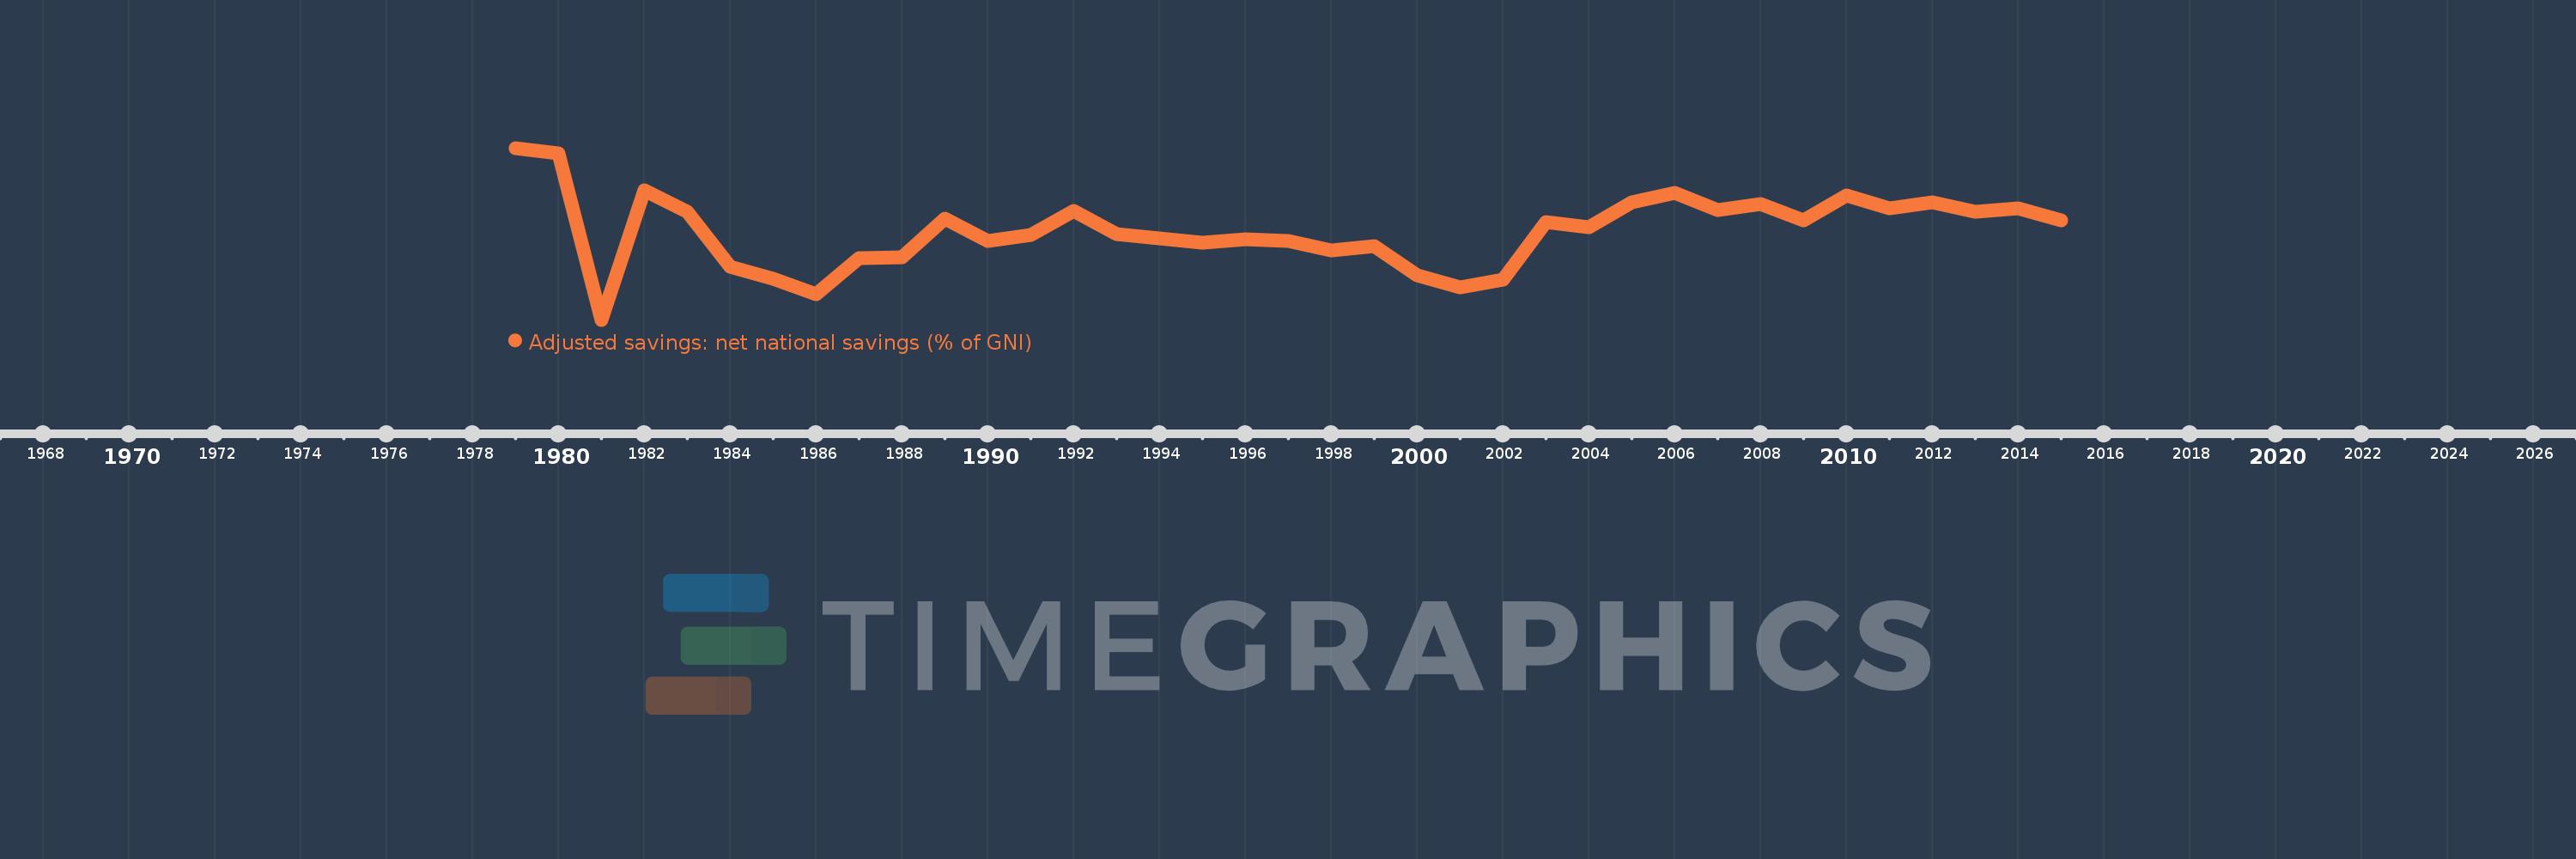
Adjusted savings: net national savings (% of GNI)
2015,2014,2013,2012,2011,2010,2009,2008,2007,2006,2005,2004,2003,2002,2001,2000,1999,1998,1997,1996,1995,1994,1993,1992,1991,1990,1989,1988,1987,1986,1985,1984,1983,1982,1981,1980,1979
This statistics in other country:
AfghanistanAlbaniaAlgeriaAngolaAntigua and BarbudaArab WorldArgentinaArmeniaAustraliaAustriaAzerbaijanBahamas, TheBahrainBangladeshBarbadosBelarusBelgiumBelizeBeninBermudaBhutanBoliviaBosnia and HerzegovinaBotswanaBrazilBrunei DarussalamBulgariaBurkina FasoBurundiCabo VerdeCambodiaCameroonCanadaCaribbean small statesCentral African RepublicCentral Europe and the BalticsChadChileChinaColombiaComorosCongo, Dem. Rep.Congo, Rep.Costa RicaCote d'IvoireCroatiaCyprusCzech RepublicDenmarkDjiboutiDominicaDominican RepublicEarly-demographic dividendEast Asia & PacificEast Asia & Pacific (excluding high income)East Asia & Pacific (IDA & IBRD countries)EcuadorEgypt, Arab Rep.El SalvadorEquatorial GuineaEritreaEstoniaEthiopiaEuro areaEurope & Central AsiaEurope & Central Asia (excluding high income)Europe & Central Asia (IDA & IBRD countries)European UnionFijiFinlandFragile and conflict affected situationsFranceGabonGambia, TheGeorgiaGermanyGhanaGreeceGrenadaGuatemalaGuineaGuinea-BissauGuyanaHaitiHeavily indebted poor countries (HIPC)High incomeHondurasHong Kong SAR, ChinaHungaryIBRD onlyIcelandIDA & IBRD totalIDA blendIDA onlyIDA totalIndiaIndonesiaIran, Islamic Rep.IraqIrelandIsraelItalyJamaicaJapanJordanKazakhstanKenyaKiribatiKorea, Rep.KosovoKuwaitKyrgyz RepublicLao PDRLate-demographic dividendLatin America & Caribbean Latin America & Caribbean (excluding high income)Latin America & the Caribbean (IDA & IBRD countries)LatviaLeast developed countries: UN classificationLebanonLesothoLiberiaLibyaLithuaniaLow & middle incomeLow incomeLower middle incomeLuxembourgMacao SAR, ChinaMacedonia, FYRMadagascarMalawiMalaysiaMaldivesMaliMaltaMauritaniaMauritiusMexicoMiddle East & North AfricaMiddle East & North Africa (excluding high income)Middle East & North Africa (IDA & IBRD countries)Middle incomeMoldovaMongoliaMontenegroMoroccoMozambiqueNamibiaNepalNetherlandsNew ZealandNicaraguaNigerNigeriaNorth AmericaNorwayOECD membersOmanOther small statesPacific island small statesPakistanPanamaPapua New GuineaParaguayPeruPhilippinesPolandPortugalPost-demographic dividendPre-demographic dividendQatarRomaniaRussian FederationRwandaSaudi ArabiaSenegalSerbiaSeychellesSierra LeoneSingaporeSlovak RepublicSloveniaSmall statesSolomon IslandsSouth AfricaSouth AsiaSouth Asia (IDA & IBRD)SpainSri LankaSt. Kitts and NevisSt. LuciaSt. Vincent and the GrenadinesSub-Saharan Africa Sub-Saharan Africa (excluding high income)Sub-Saharan Africa (IDA & IBRD countries)SudanSurinameSwazilandSwedenSwitzerlandSyrian Arab RepublicTajikistanTanzaniaThailandTimor-LesteTogoTongaTrinidad and TobagoTunisiaTurkeyTurkmenistanUgandaUkraineUnited KingdomUnited StatesUpper middle incomeUruguayVanuatuVenezuela, RBVietnamWest Bank and GazaWorldYemen, Rep.ZambiaZimbabwe Timeline:
This timeline shows a graph from 1979 to 2015 of Uruguay. No data until 1978. Number of actual observations by date: 37.
Source name:
World Development Indicators
Source organization:
World Bank staff estimates based on sources and methods in World Bank's "The Changing Wealth of Nations: Measuring Sustainable Development in the New Millennium" (2011).
Categories, topics:
Economy & Growth, Environment
Last updated:
apr 23, 2017
Indicators value changes by year
Maximum:
11.675
jan 1, 1979
At the date of observation
Value
Absolute change
Change from previous value
jan 1, 1979
11.675
+11.675
0.0%
jan 1, 1980
11.311
-0.364
-3.12%
jan 1, 1981
-0.53
-11.841
-104.69%
jan 1, 1982
8.693
+9.223
-1.74K%
jan 1, 1983
7.168
-1.525
-17.54%
jan 1, 1984
3.208
-3.96
-55.24%
jan 1, 1985
2.377
-0.832
-25.92%
jan 1, 1986
1.306
-1.071
-45.05%
jan 1, 1987
3.872
+2.566
196.49%
jan 1, 1988
3.924
+0.051
1.33%
jan 1, 1989
6.623
+2.699
68.79%
jan 1, 1990
5.065
-1.558
-23.52%
jan 1, 1991
5.482
+0.417
8.22%
jan 1, 1992
7.227
+1.746
31.84%
jan 1, 1993
5.58
-1.647
-22.79%
jan 1, 1994
5.238
-0.342
-6.14%
jan 1, 1995
4.958
-0.279
-5.33%
jan 1, 1996
5.205
+0.246
4.97%
jan 1, 1997
5.055
-0.15
-2.88%
jan 1, 1998
4.391
-0.665
-13.15%
jan 1, 1999
4.715
+0.325
7.4%
jan 1, 2000
2.654
-2.061
-43.71%
jan 1, 2001
1.786
-0.868
-32.7%
jan 1, 2002
2.346
+0.559
31.32%
jan 1, 2003
6.392
+4.046
172.46%
jan 1, 2004
6.036
-0.355
-5.56%
jan 1, 2005
7.809
+1.773
29.37%
jan 1, 2006
8.468
+0.658
8.43%
jan 1, 2007
7.244
-1.224
-14.45%
jan 1, 2008
7.69
+0.446
6.15%
jan 1, 2009
6.56
-1.13
-14.69%
jan 1, 2010
8.313
+1.754
26.73%
jan 1, 2011
7.377
-0.937
-11.27%
jan 1, 2012
7.822
+0.445
6.04%
jan 1, 2013
7.134
-0.688
-8.8%
jan 1, 2014
7.412
+0.278
3.9%
jan 1, 2015
6.545
-0.866
-11.69%
Ranking of countries by current statistics by years


Comments: