29
/
en
AIzaSyAYiBZKx7MnpbEhh9jyipgxe19OcubqV5w
April 1, 2024
62352
World
WLD
false
2
1
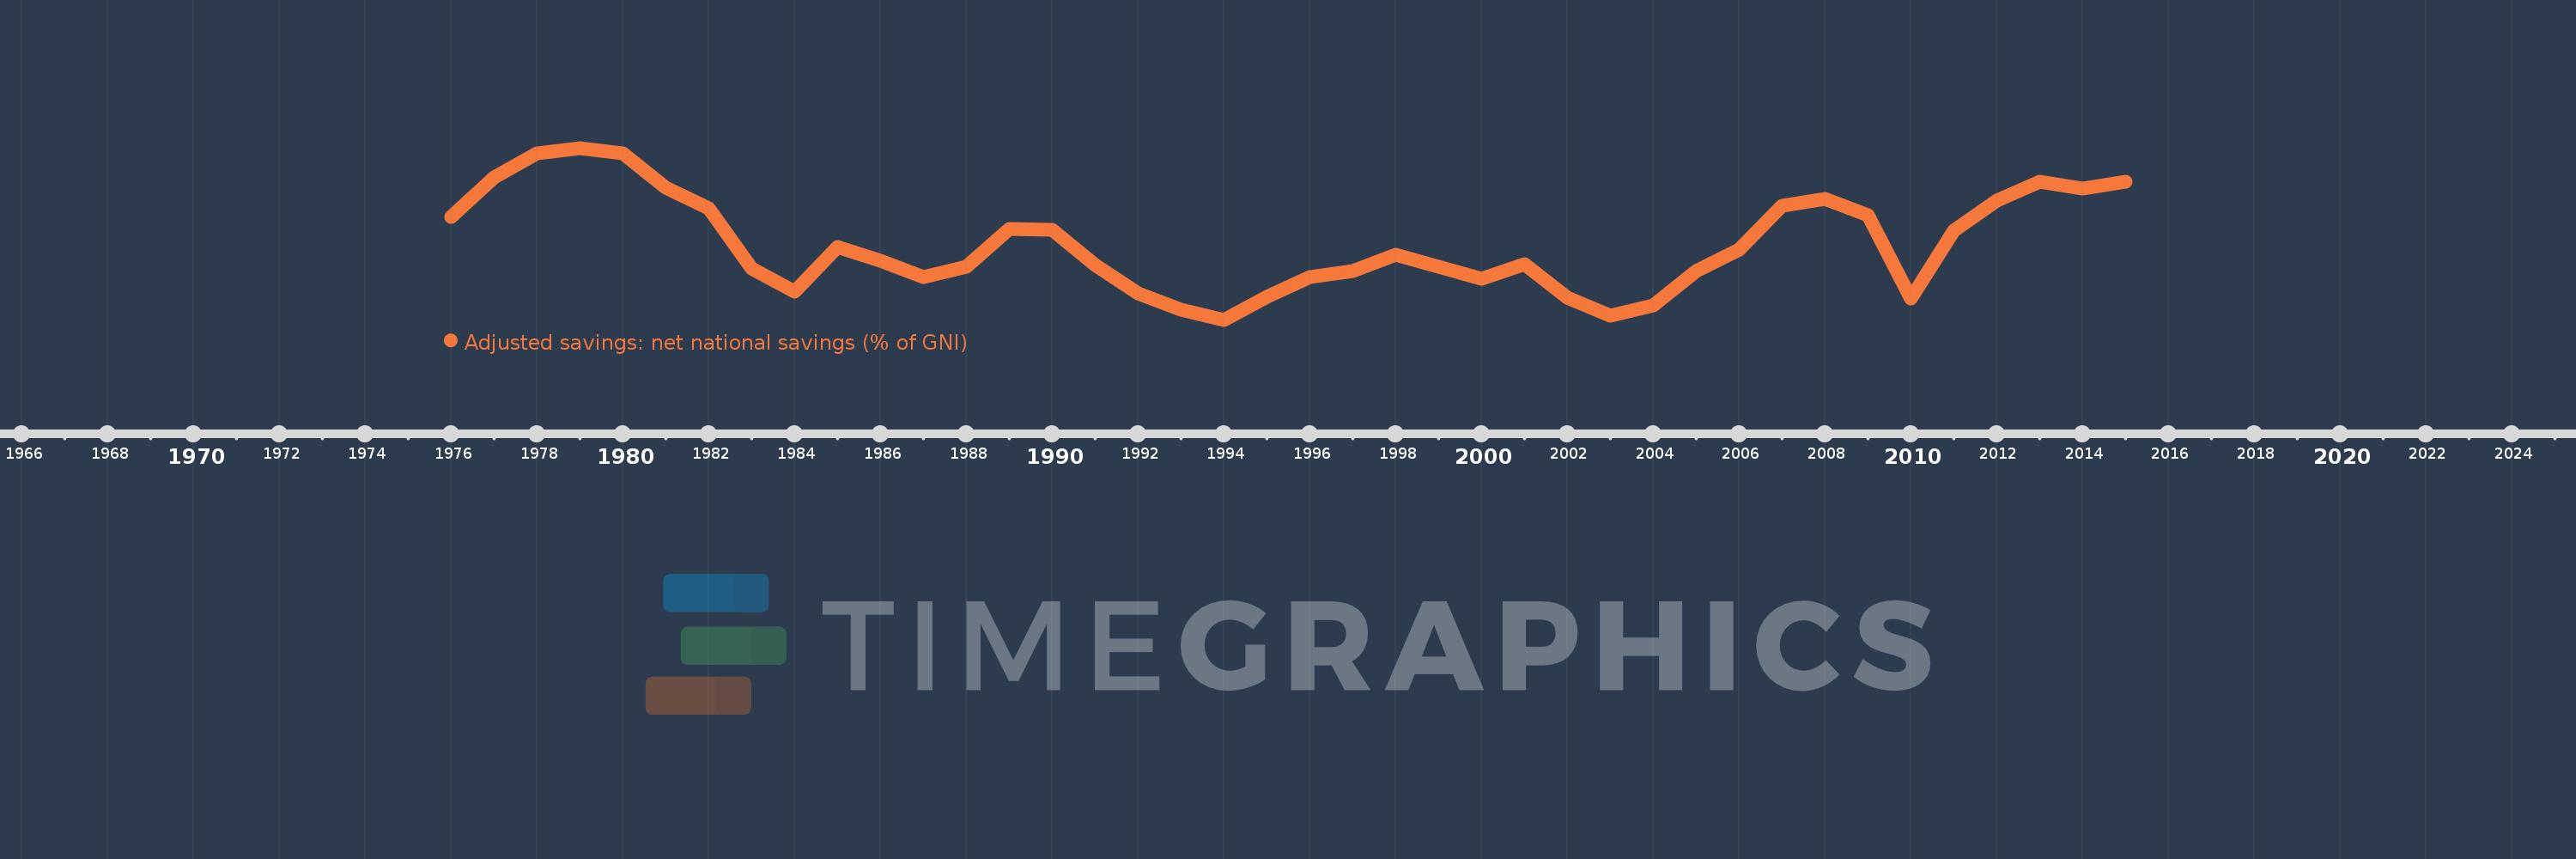
Adjusted savings: net national savings (% of GNI)
2015,2014,2013,2012,2011,2010,2009,2008,2007,2006,2005,2004,2003,2002,2001,2000,1999,1998,1997,1996,1995,1994,1993,1992,1991,1990,1989,1988,1987,1986,1985,1984,1983,1982,1981,1980,1979,1978,1977,1976
This statistics in other country:
AfghanistanAlbaniaAlgeriaAngolaAntigua and BarbudaArab WorldArgentinaArmeniaAustraliaAustriaAzerbaijanBahamas, TheBahrainBangladeshBarbadosBelarusBelgiumBelizeBeninBermudaBhutanBoliviaBosnia and HerzegovinaBotswanaBrazilBrunei DarussalamBulgariaBurkina FasoBurundiCabo VerdeCambodiaCameroonCanadaCaribbean small statesCentral African RepublicCentral Europe and the BalticsChadChileChinaColombiaComorosCongo, Dem. Rep.Congo, Rep.Costa RicaCote d'IvoireCroatiaCyprusCzech RepublicDenmarkDjiboutiDominicaDominican RepublicEarly-demographic dividendEast Asia & PacificEast Asia & Pacific (excluding high income)East Asia & Pacific (IDA & IBRD countries)EcuadorEgypt, Arab Rep.El SalvadorEquatorial GuineaEritreaEstoniaEthiopiaEuro areaEurope & Central AsiaEurope & Central Asia (excluding high income)Europe & Central Asia (IDA & IBRD countries)European UnionFijiFinlandFragile and conflict affected situationsFranceGabonGambia, TheGeorgiaGermanyGhanaGreeceGrenadaGuatemalaGuineaGuinea-BissauGuyanaHaitiHeavily indebted poor countries (HIPC)High incomeHondurasHong Kong SAR, ChinaHungaryIBRD onlyIcelandIDA & IBRD totalIDA blendIDA onlyIDA totalIndiaIndonesiaIran, Islamic Rep.IraqIrelandIsraelItalyJamaicaJapanJordanKazakhstanKenyaKiribatiKorea, Rep.KosovoKuwaitKyrgyz RepublicLao PDRLate-demographic dividendLatin America & Caribbean Latin America & Caribbean (excluding high income)Latin America & the Caribbean (IDA & IBRD countries)LatviaLeast developed countries: UN classificationLebanonLesothoLiberiaLibyaLithuaniaLow & middle incomeLow incomeLower middle incomeLuxembourgMacao SAR, ChinaMacedonia, FYRMadagascarMalawiMalaysiaMaldivesMaliMaltaMauritaniaMauritiusMexicoMiddle East & North AfricaMiddle East & North Africa (excluding high income)Middle East & North Africa (IDA & IBRD countries)Middle incomeMoldovaMongoliaMontenegroMoroccoMozambiqueNamibiaNepalNetherlandsNew ZealandNicaraguaNigerNigeriaNorth AmericaNorwayOECD membersOmanOther small statesPacific island small statesPakistanPanamaPapua New GuineaParaguayPeruPhilippinesPolandPortugalPost-demographic dividendPre-demographic dividendQatarRomaniaRussian FederationRwandaSaudi ArabiaSenegalSerbiaSeychellesSierra LeoneSingaporeSlovak RepublicSloveniaSmall statesSolomon IslandsSouth AfricaSouth AsiaSouth Asia (IDA & IBRD)SpainSri LankaSt. Kitts and NevisSt. LuciaSt. Vincent and the GrenadinesSub-Saharan Africa Sub-Saharan Africa (excluding high income)Sub-Saharan Africa (IDA & IBRD countries)SudanSurinameSwazilandSwedenSwitzerlandSyrian Arab RepublicTajikistanTanzaniaThailandTimor-LesteTogoTongaTrinidad and TobagoTunisiaTurkeyTurkmenistanUgandaUkraineUnited KingdomUnited StatesUpper middle incomeUruguayVanuatuVenezuela, RBVietnamWest Bank and GazaWorldYemen, Rep.ZambiaZimbabwe Timeline:
This timeline shows a graph from 1976 to 2015 of World. No data until 1975. Number of actual observations by date: 40.
Source name:
World Development Indicators
Source organization:
World Bank staff estimates based on sources and methods in World Bank's "The Changing Wealth of Nations: Measuring Sustainable Development in the New Millennium" (2011).
Categories, topics:
Economy & Growth, Environment
Last updated:
apr 23, 2017
Indicators value changes by year
Maximum:
12.216
jan 1, 1979
At the date of observation
Value
Absolute change
Change from previous value
jan 1, 1976
10.103
+10.103
0.0%
jan 1, 1977
11.33
+1.228
12.15%
jan 1, 1978
12.061
+0.73
6.45%
jan 1, 1979
12.216
+0.155
1.28%
jan 1, 1980
12.059
-0.157
-1.28%
jan 1, 1981
11.004
-1.055
-8.75%
jan 1, 1982
10.371
-0.633
-5.75%
jan 1, 1983
8.543
-1.828
-17.63%
jan 1, 1984
7.828
-0.714
-8.36%
jan 1, 1985
9.198
+1.369
17.49%
jan 1, 1986
8.765
-0.433
-4.71%
jan 1, 1987
8.28
-0.485
-5.53%
jan 1, 1988
8.582
+0.303
3.66%
jan 1, 1989
9.749
+1.167
13.59%
jan 1, 1990
9.728
-0.021
-0.21%
jan 1, 1991
8.655
-1.074
-11.04%
jan 1, 1992
7.776
-0.879
-10.16%
jan 1, 1993
7.287
-0.489
-6.29%
jan 1, 1994
6.977
-0.31
-4.26%
jan 1, 1995
7.664
+0.687
9.85%
jan 1, 1996
8.284
+0.621
8.1%
jan 1, 1997
8.463
+0.179
2.16%
jan 1, 1998
8.963
+0.5
5.91%
jan 1, 1999
8.589
-0.374
-4.17%
jan 1, 2000
8.224
-0.365
-4.25%
jan 1, 2001
8.669
+0.445
5.41%
jan 1, 2002
7.64
-1.029
-11.87%
jan 1, 2003
7.112
-0.529
-6.92%
jan 1, 2004
7.407
+0.295
4.15%
jan 1, 2005
8.468
+1.061
14.33%
jan 1, 2006
9.125
+0.657
7.76%
jan 1, 2007
10.457
+1.332
14.6%
jan 1, 2008
10.663
+0.206
1.97%
jan 1, 2009
10.169
-0.495
-4.64%
jan 1, 2010
7.618
-2.55
-25.08%
jan 1, 2011
9.682
+2.064
27.09%
jan 1, 2012
10.616
+0.934
9.65%
jan 1, 2013
11.175
+0.559
5.26%
jan 1, 2014
10.979
-0.196
-1.75%
jan 1, 2015
11.177
+0.198
1.8%
Ranking of countries by current statistics by years


Comments: