29
/
en
AIzaSyAYiBZKx7MnpbEhh9jyipgxe19OcubqV5w
April 1, 2024
234365
Saudi Arabia
SAU
true
2
1
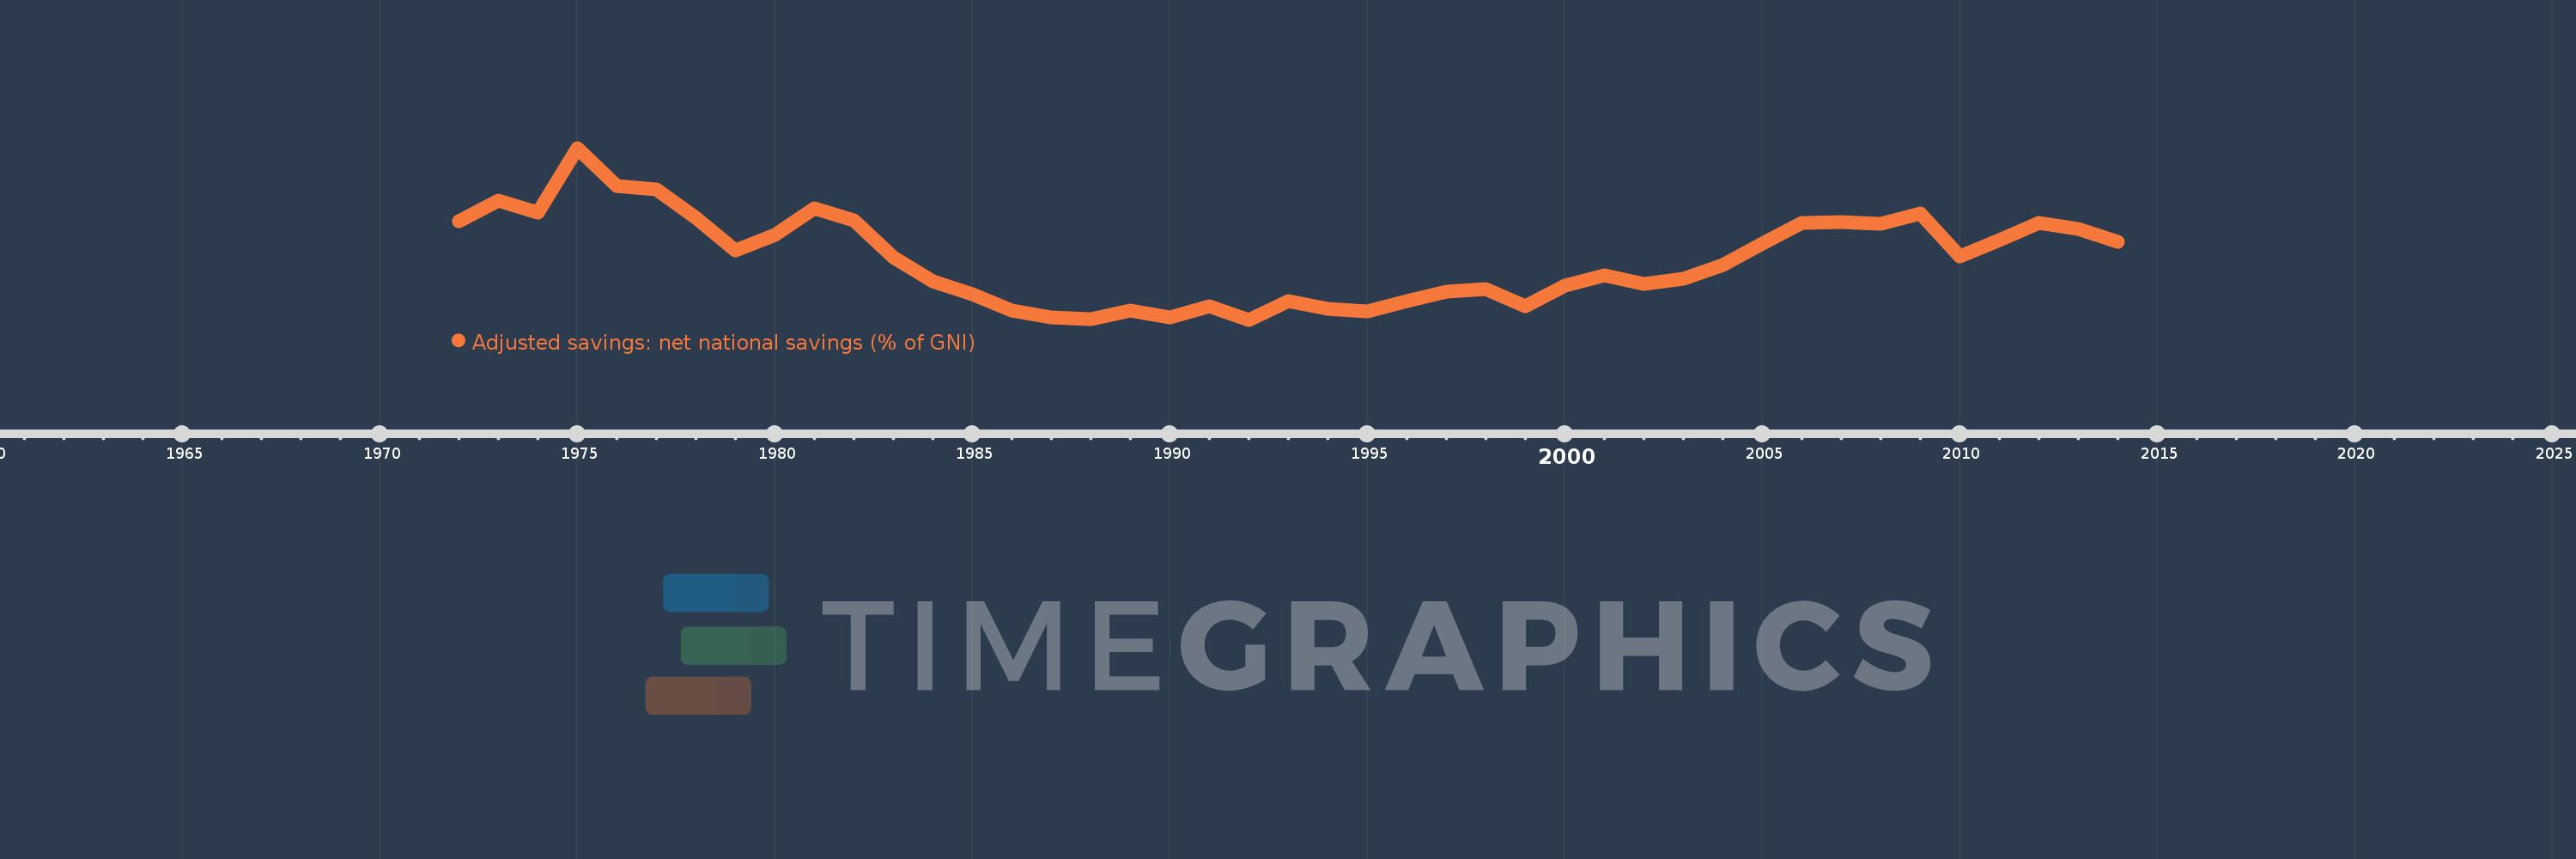
Adjusted savings: net national savings (% of GNI)
2014,2013,2012,2011,2010,2009,2008,2007,2006,2005,2004,2003,2002,2001,2000,1999,1998,1997,1996,1995,1994,1993,1992,1991,1990,1989,1988,1987,1986,1985,1984,1983,1982,1981,1980,1979,1978,1977,1976,1975,1974,1973,1972
This statistics in other country:
AfghanistanAlbaniaAlgeriaAngolaAntigua and BarbudaArab WorldArgentinaArmeniaAustraliaAustriaAzerbaijanBahamas, TheBahrainBangladeshBarbadosBelarusBelgiumBelizeBeninBermudaBhutanBoliviaBosnia and HerzegovinaBotswanaBrazilBrunei DarussalamBulgariaBurkina FasoBurundiCabo VerdeCambodiaCameroonCanadaCaribbean small statesCentral African RepublicCentral Europe and the BalticsChadChileChinaColombiaComorosCongo, Dem. Rep.Congo, Rep.Costa RicaCote d'IvoireCroatiaCyprusCzech RepublicDenmarkDjiboutiDominicaDominican RepublicEarly-demographic dividendEast Asia & PacificEast Asia & Pacific (excluding high income)East Asia & Pacific (IDA & IBRD countries)EcuadorEgypt, Arab Rep.El SalvadorEquatorial GuineaEritreaEstoniaEthiopiaEuro areaEurope & Central AsiaEurope & Central Asia (excluding high income)Europe & Central Asia (IDA & IBRD countries)European UnionFijiFinlandFragile and conflict affected situationsFranceGabonGambia, TheGeorgiaGermanyGhanaGreeceGrenadaGuatemalaGuineaGuinea-BissauGuyanaHaitiHeavily indebted poor countries (HIPC)High incomeHondurasHong Kong SAR, ChinaHungaryIBRD onlyIcelandIDA & IBRD totalIDA blendIDA onlyIDA totalIndiaIndonesiaIran, Islamic Rep.IraqIrelandIsraelItalyJamaicaJapanJordanKazakhstanKenyaKiribatiKorea, Rep.KosovoKuwaitKyrgyz RepublicLao PDRLate-demographic dividendLatin America & Caribbean Latin America & Caribbean (excluding high income)Latin America & the Caribbean (IDA & IBRD countries)LatviaLeast developed countries: UN classificationLebanonLesothoLiberiaLibyaLithuaniaLow & middle incomeLow incomeLower middle incomeLuxembourgMacao SAR, ChinaMacedonia, FYRMadagascarMalawiMalaysiaMaldivesMaliMaltaMauritaniaMauritiusMexicoMiddle East & North AfricaMiddle East & North Africa (excluding high income)Middle East & North Africa (IDA & IBRD countries)Middle incomeMoldovaMongoliaMontenegroMoroccoMozambiqueNamibiaNepalNetherlandsNew ZealandNicaraguaNigerNigeriaNorth AmericaNorwayOECD membersOmanOther small statesPacific island small statesPakistanPanamaPapua New GuineaParaguayPeruPhilippinesPolandPortugalPost-demographic dividendPre-demographic dividendQatarRomaniaRussian FederationRwandaSaudi ArabiaSenegalSerbiaSeychellesSierra LeoneSingaporeSlovak RepublicSloveniaSmall statesSolomon IslandsSouth AfricaSouth AsiaSouth Asia (IDA & IBRD)SpainSri LankaSt. Kitts and NevisSt. LuciaSt. Vincent and the GrenadinesSub-Saharan Africa Sub-Saharan Africa (excluding high income)Sub-Saharan Africa (IDA & IBRD countries)SudanSurinameSwazilandSwedenSwitzerlandSyrian Arab RepublicTajikistanTanzaniaThailandTimor-LesteTogoTongaTrinidad and TobagoTunisiaTurkeyTurkmenistanUgandaUkraineUnited KingdomUnited StatesUpper middle incomeUruguayVanuatuVenezuela, RBVietnamWest Bank and GazaWorldYemen, Rep.ZambiaZimbabwe Timeline:
This timeline shows a graph from 1972 to 2014 of Saudi Arabia. No data until 1971. Number of actual observations by date: 43.
Source name:
World Development Indicators
Source organization:
World Bank staff estimates based on sources and methods in World Bank's "The Changing Wealth of Nations: Measuring Sustainable Development in the New Millennium" (2011).
Categories, topics:
Economy & Growth, Environment
Last updated:
apr 23, 2017
Indicators value changes by year
Maximum:
71.831
jan 1, 1975
At the date of observation
Value
Absolute change
Change from previous value
jan 1, 1972
42.438
+42.438
0.0%
jan 1, 1973
50.859
+8.422
19.84%
jan 1, 1974
46.081
-4.778
-9.39%
jan 1, 1975
71.831
+25.75
55.88%
jan 1, 1976
56.436
-15.395
-21.43%
jan 1, 1977
55.234
-1.202
-2.13%
jan 1, 1978
43.998
-11.236
-20.34%
jan 1, 1979
30.721
-13.277
-30.18%
jan 1, 1980
36.959
+6.237
20.3%
jan 1, 1981
47.729
+10.771
29.14%
jan 1, 1982
42.713
-5.016
-10.51%
jan 1, 1983
28.087
-14.626
-34.24%
jan 1, 1984
18.201
-9.886
-35.2%
jan 1, 1985
13.23
-4.971
-27.31%
jan 1, 1986
6.632
-6.598
-49.87%
jan 1, 1987
3.808
-2.824
-42.58%
jan 1, 1988
3.102
-0.706
-18.55%
jan 1, 1989
6.57
+3.468
111.81%
jan 1, 1990
4.054
-2.516
-38.3%
jan 1, 1991
8.413
+4.358
107.5%
jan 1, 1992
2.984
-5.428
-64.53%
jan 1, 1993
10.616
+7.632
255.73%
jan 1, 1994
7.328
-3.287
-30.97%
jan 1, 1995
6.461
-0.868
-11.84%
jan 1, 1996
10.597
+4.136
64.01%
jan 1, 1997
14.237
+3.64
34.35%
jan 1, 1998
15.175
+0.938
6.59%
jan 1, 1999
8.497
-6.678
-44.01%
jan 1, 2000
16.651
+8.153
95.95%
jan 1, 2001
20.756
+4.106
24.66%
jan 1, 2002
17.169
-3.587
-17.28%
jan 1, 2003
19.245
+2.076
12.09%
jan 1, 2004
24.992
+5.747
29.86%
jan 1, 2005
33.443
+8.451
33.81%
jan 1, 2006
41.908
+8.466
25.31%
jan 1, 2007
42.044
+0.135
0.32%
jan 1, 2008
41.455
-0.589
-1.4%
jan 1, 2009
45.604
+4.149
10.01%
jan 1, 2010
28.287
-17.317
-37.97%
jan 1, 2011
35.012
+6.726
23.78%
jan 1, 2012
41.669
+6.657
19.01%
jan 1, 2013
39.422
-2.247
-5.39%
jan 1, 2014
34.205
-5.217
-13.23%
Ranking of countries by current statistics by years


Comments: