29
/
en
AIzaSyAYiBZKx7MnpbEhh9jyipgxe19OcubqV5w
April 1, 2024
214009
Norway
NOR
true
2
1
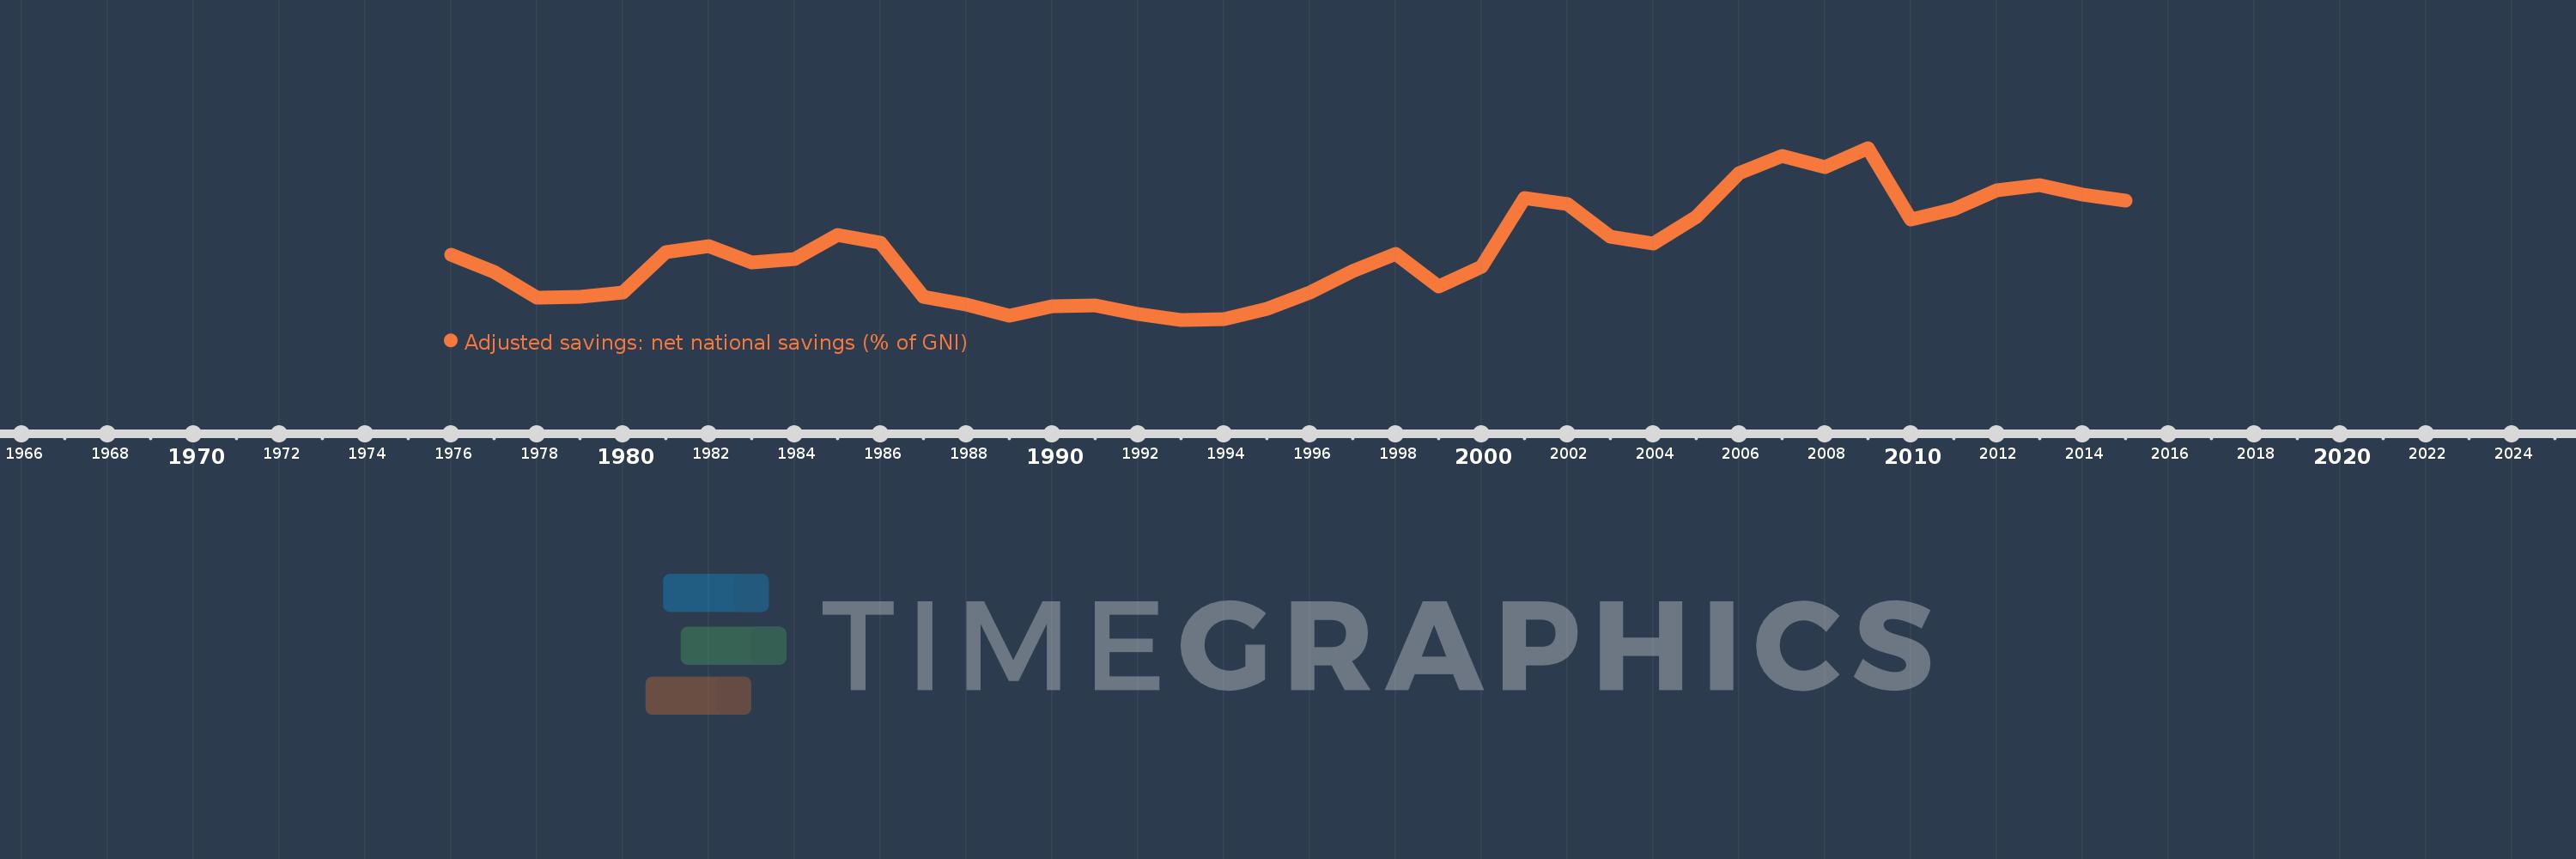
Adjusted savings: net national savings (% of GNI)
2015,2014,2013,2012,2011,2010,2009,2008,2007,2006,2005,2004,2003,2002,2001,2000,1999,1998,1997,1996,1995,1994,1993,1992,1991,1990,1989,1988,1987,1986,1985,1984,1983,1982,1981,1980,1979,1978,1977,1976
This statistics in other country:
AfghanistanAlbaniaAlgeriaAngolaAntigua and BarbudaArab WorldArgentinaArmeniaAustraliaAustriaAzerbaijanBahamas, TheBahrainBangladeshBarbadosBelarusBelgiumBelizeBeninBermudaBhutanBoliviaBosnia and HerzegovinaBotswanaBrazilBrunei DarussalamBulgariaBurkina FasoBurundiCabo VerdeCambodiaCameroonCanadaCaribbean small statesCentral African RepublicCentral Europe and the BalticsChadChileChinaColombiaComorosCongo, Dem. Rep.Congo, Rep.Costa RicaCote d'IvoireCroatiaCyprusCzech RepublicDenmarkDjiboutiDominicaDominican RepublicEarly-demographic dividendEast Asia & PacificEast Asia & Pacific (excluding high income)East Asia & Pacific (IDA & IBRD countries)EcuadorEgypt, Arab Rep.El SalvadorEquatorial GuineaEritreaEstoniaEthiopiaEuro areaEurope & Central AsiaEurope & Central Asia (excluding high income)Europe & Central Asia (IDA & IBRD countries)European UnionFijiFinlandFragile and conflict affected situationsFranceGabonGambia, TheGeorgiaGermanyGhanaGreeceGrenadaGuatemalaGuineaGuinea-BissauGuyanaHaitiHeavily indebted poor countries (HIPC)High incomeHondurasHong Kong SAR, ChinaHungaryIBRD onlyIcelandIDA & IBRD totalIDA blendIDA onlyIDA totalIndiaIndonesiaIran, Islamic Rep.IraqIrelandIsraelItalyJamaicaJapanJordanKazakhstanKenyaKiribatiKorea, Rep.KosovoKuwaitKyrgyz RepublicLao PDRLate-demographic dividendLatin America & Caribbean Latin America & Caribbean (excluding high income)Latin America & the Caribbean (IDA & IBRD countries)LatviaLeast developed countries: UN classificationLebanonLesothoLiberiaLibyaLithuaniaLow & middle incomeLow incomeLower middle incomeLuxembourgMacao SAR, ChinaMacedonia, FYRMadagascarMalawiMalaysiaMaldivesMaliMaltaMauritaniaMauritiusMexicoMiddle East & North AfricaMiddle East & North Africa (excluding high income)Middle East & North Africa (IDA & IBRD countries)Middle incomeMoldovaMongoliaMontenegroMoroccoMozambiqueNamibiaNepalNetherlandsNew ZealandNicaraguaNigerNigeriaNorth AmericaNorwayOECD membersOmanOther small statesPacific island small statesPakistanPanamaPapua New GuineaParaguayPeruPhilippinesPolandPortugalPost-demographic dividendPre-demographic dividendQatarRomaniaRussian FederationRwandaSaudi ArabiaSenegalSerbiaSeychellesSierra LeoneSingaporeSlovak RepublicSloveniaSmall statesSolomon IslandsSouth AfricaSouth AsiaSouth Asia (IDA & IBRD)SpainSri LankaSt. Kitts and NevisSt. LuciaSt. Vincent and the GrenadinesSub-Saharan Africa Sub-Saharan Africa (excluding high income)Sub-Saharan Africa (IDA & IBRD countries)SudanSurinameSwazilandSwedenSwitzerlandSyrian Arab RepublicTajikistanTanzaniaThailandTimor-LesteTogoTongaTrinidad and TobagoTunisiaTurkeyTurkmenistanUgandaUkraineUnited KingdomUnited StatesUpper middle incomeUruguayVanuatuVenezuela, RBVietnamWest Bank and GazaWorldYemen, Rep.ZambiaZimbabwe Timeline:
This timeline shows a graph from 1976 to 2015 of Norway. No data until 1975. Number of actual observations by date: 40.
Source name:
World Development Indicators
Source organization:
World Bank staff estimates based on sources and methods in World Bank's "The Changing Wealth of Nations: Measuring Sustainable Development in the New Millennium" (2011).
Categories, topics:
Economy & Growth, Environment
Last updated:
apr 23, 2017
Indicators value changes by year
Maximum:
27.803
jan 1, 2009
At the date of observation
Value
Absolute change
Change from previous value
jan 1, 1976
14.76
+14.76
0.0%
jan 1, 1977
12.659
-2.101
-14.23%
jan 1, 1978
9.532
-3.127
-24.7%
jan 1, 1979
9.625
+0.093
0.98%
jan 1, 1980
10.217
+0.592
6.15%
jan 1, 1981
15.09
+4.873
47.69%
jan 1, 1982
15.895
+0.806
5.34%
jan 1, 1983
13.842
-2.053
-12.91%
jan 1, 1984
14.278
+0.436
3.15%
jan 1, 1985
17.172
+2.894
20.27%
jan 1, 1986
16.281
-0.891
-5.19%
jan 1, 1987
9.619
-6.662
-40.92%
jan 1, 1988
8.757
-0.863
-8.97%
jan 1, 1989
7.359
-1.398
-15.96%
jan 1, 1990
8.468
+1.109
15.07%
jan 1, 1991
8.586
+0.118
1.39%
jan 1, 1992
7.61
-0.977
-11.37%
jan 1, 1993
6.877
-0.733
-9.63%
jan 1, 1994
6.944
+0.068
0.98%
jan 1, 1995
8.193
+1.249
17.99%
jan 1, 1996
10.155
+1.962
23.95%
jan 1, 1997
12.784
+2.629
25.89%
jan 1, 1998
14.917
+2.133
16.68%
jan 1, 1999
10.93
-3.988
-26.73%
jan 1, 2000
13.285
+2.355
21.55%
jan 1, 2001
21.714
+8.429
63.45%
jan 1, 2002
20.972
-0.742
-3.42%
jan 1, 2003
17.02
-3.952
-18.84%
jan 1, 2004
16.182
-0.838
-4.93%
jan 1, 2005
19.378
+3.196
19.75%
jan 1, 2006
24.723
+5.345
27.59%
jan 1, 2007
26.845
+2.122
8.58%
jan 1, 2008
25.477
-1.369
-5.1%
jan 1, 2009
27.803
+2.326
9.13%
jan 1, 2010
19.055
-8.748
-31.46%
jan 1, 2011
20.316
+1.261
6.62%
jan 1, 2012
22.649
+2.333
11.48%
jan 1, 2013
23.279
+0.63
2.78%
jan 1, 2014
22.125
-1.154
-4.96%
jan 1, 2015
21.382
-0.743
-3.36%
Ranking of countries by current statistics by years


Comments: