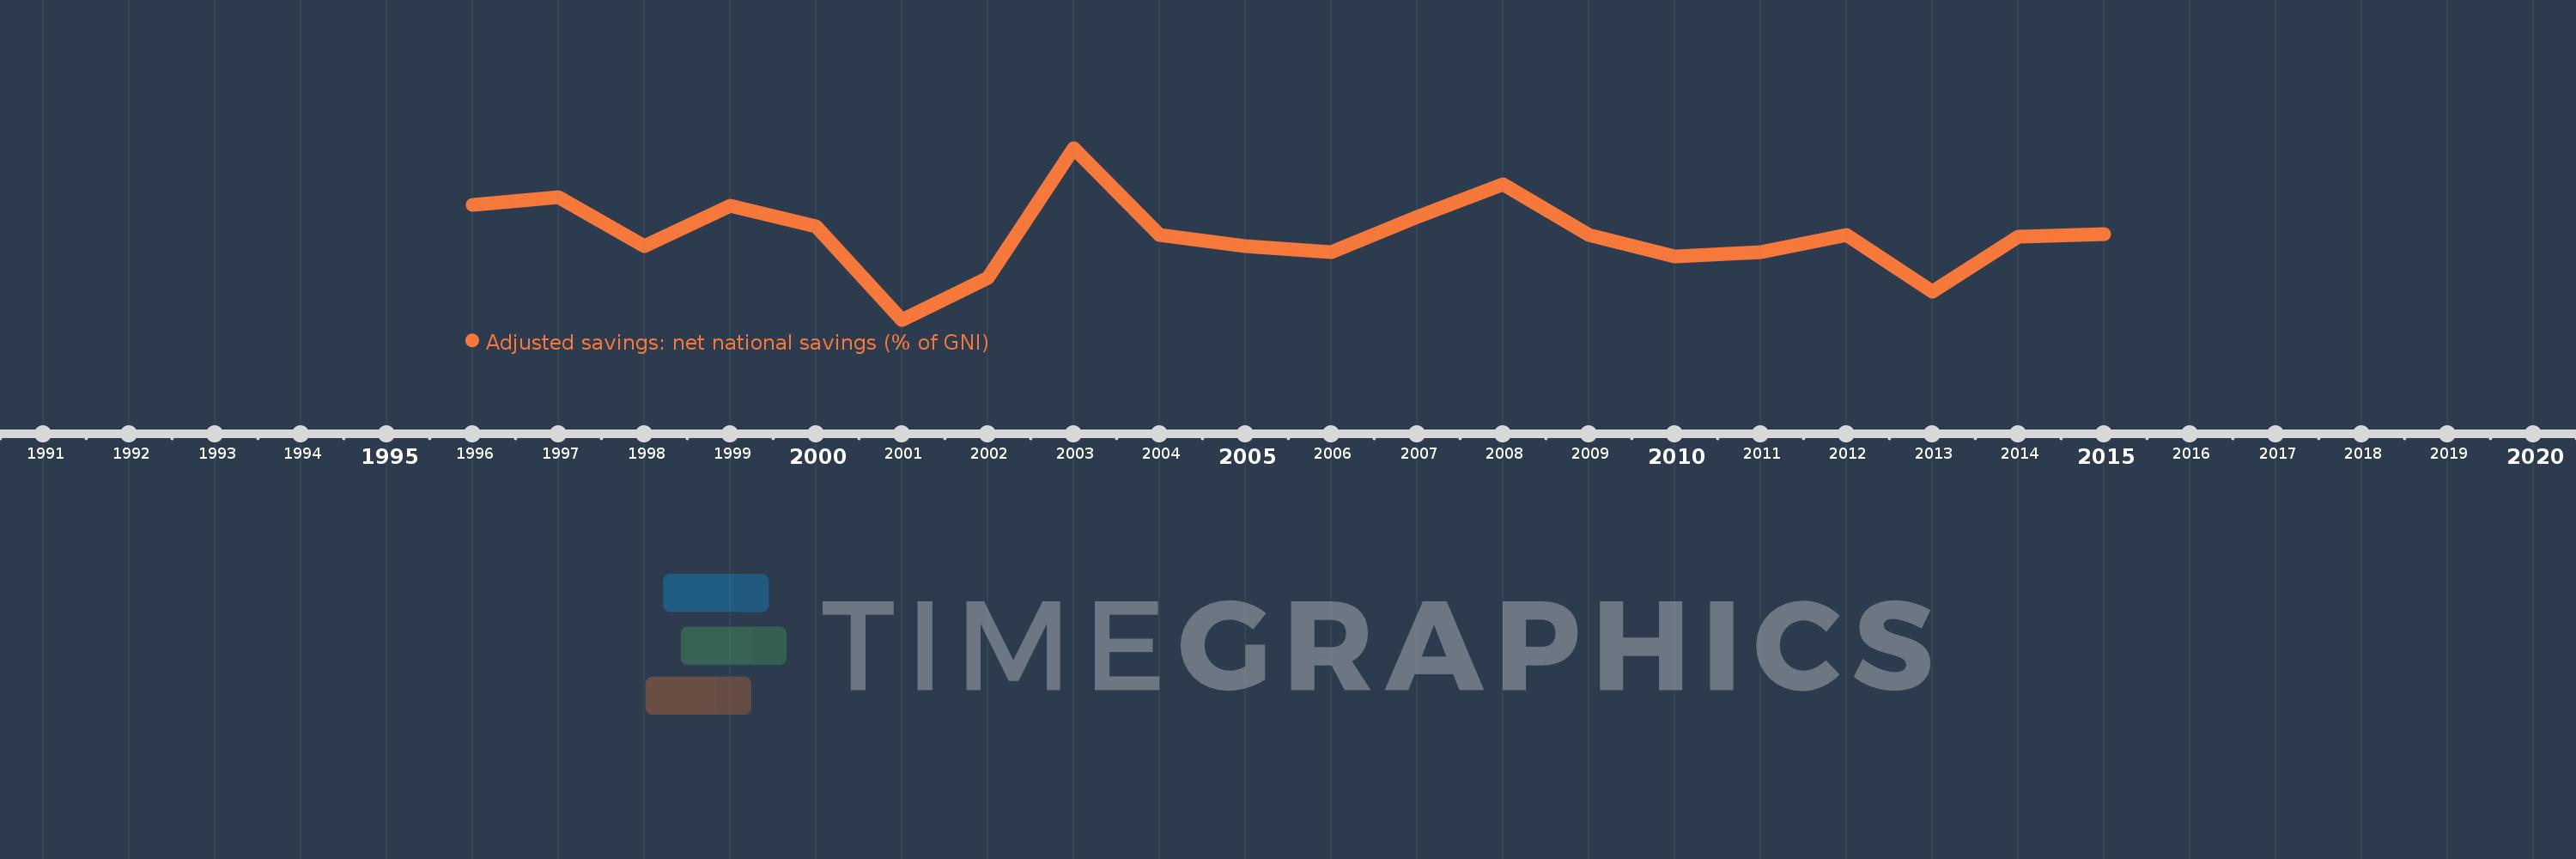
This timeline shows a graph from 1996 to 2015 of Paraguay. No data until 1995. Number of actual observations by date: 20.
Source name:
World Development Indicators
Source organization:
World Bank staff estimates based on sources and methods in World Bank's "The Changing Wealth of Nations: Measuring Sustainable Development in the New Millennium" (2011).
Categories, topics:
Economy & Growth, Environment
Last updated:
apr 23, 2017
Indicators value changes by year
Meaning:
10.909
Minimum:
4.219
jan 1, 2001
Maximum:
17.787
jan 1, 2003
At the date of observation
Value
Absolute change
Change from the previous value
jan 1, 1996
13.292
+13.292
0.0%
jan 1, 1997
13.904
+0.612
4.6%
jan 1, 1998
10.024
-3.88
-27.91%
jan 1, 1999
13.22
+3.196
31.89%
jan 1, 2000
11.615
-1.604
-12.14%
jan 1, 2001
4.219
-7.396
-63.67%
jan 1, 2002
7.551
+3.331
78.96%
jan 1, 2003
17.787
+10.236
135.57%
jan 1, 2004
10.918
-6.869
-38.62%
jan 1, 2005
10.04
-0.878
-8.04%
jan 1, 2006
9.581
-0.459
-4.57%
jan 1, 2007
12.306
+2.725
28.44%
jan 1, 2008
14.927
+2.621
21.3%
jan 1, 2009
10.895
-4.032
-27.01%
jan 1, 2010
9.202
-1.693
-15.54%
jan 1, 2011
9.574
+0.372
4.04%
jan 1, 2012
10.92
+1.346
14.06%
jan 1, 2013
6.42
-4.5
-41.21%
jan 1, 2014
10.805
+4.384
68.29%
jan 1, 2015
10.991
+0.187
1.73%
Ranking of countries by current statistics by years
