29
/
en
AIzaSyAYiBZKx7MnpbEhh9jyipgxe19OcubqV5w
April 1, 2024
73624
Austria
AUT
true
2
1
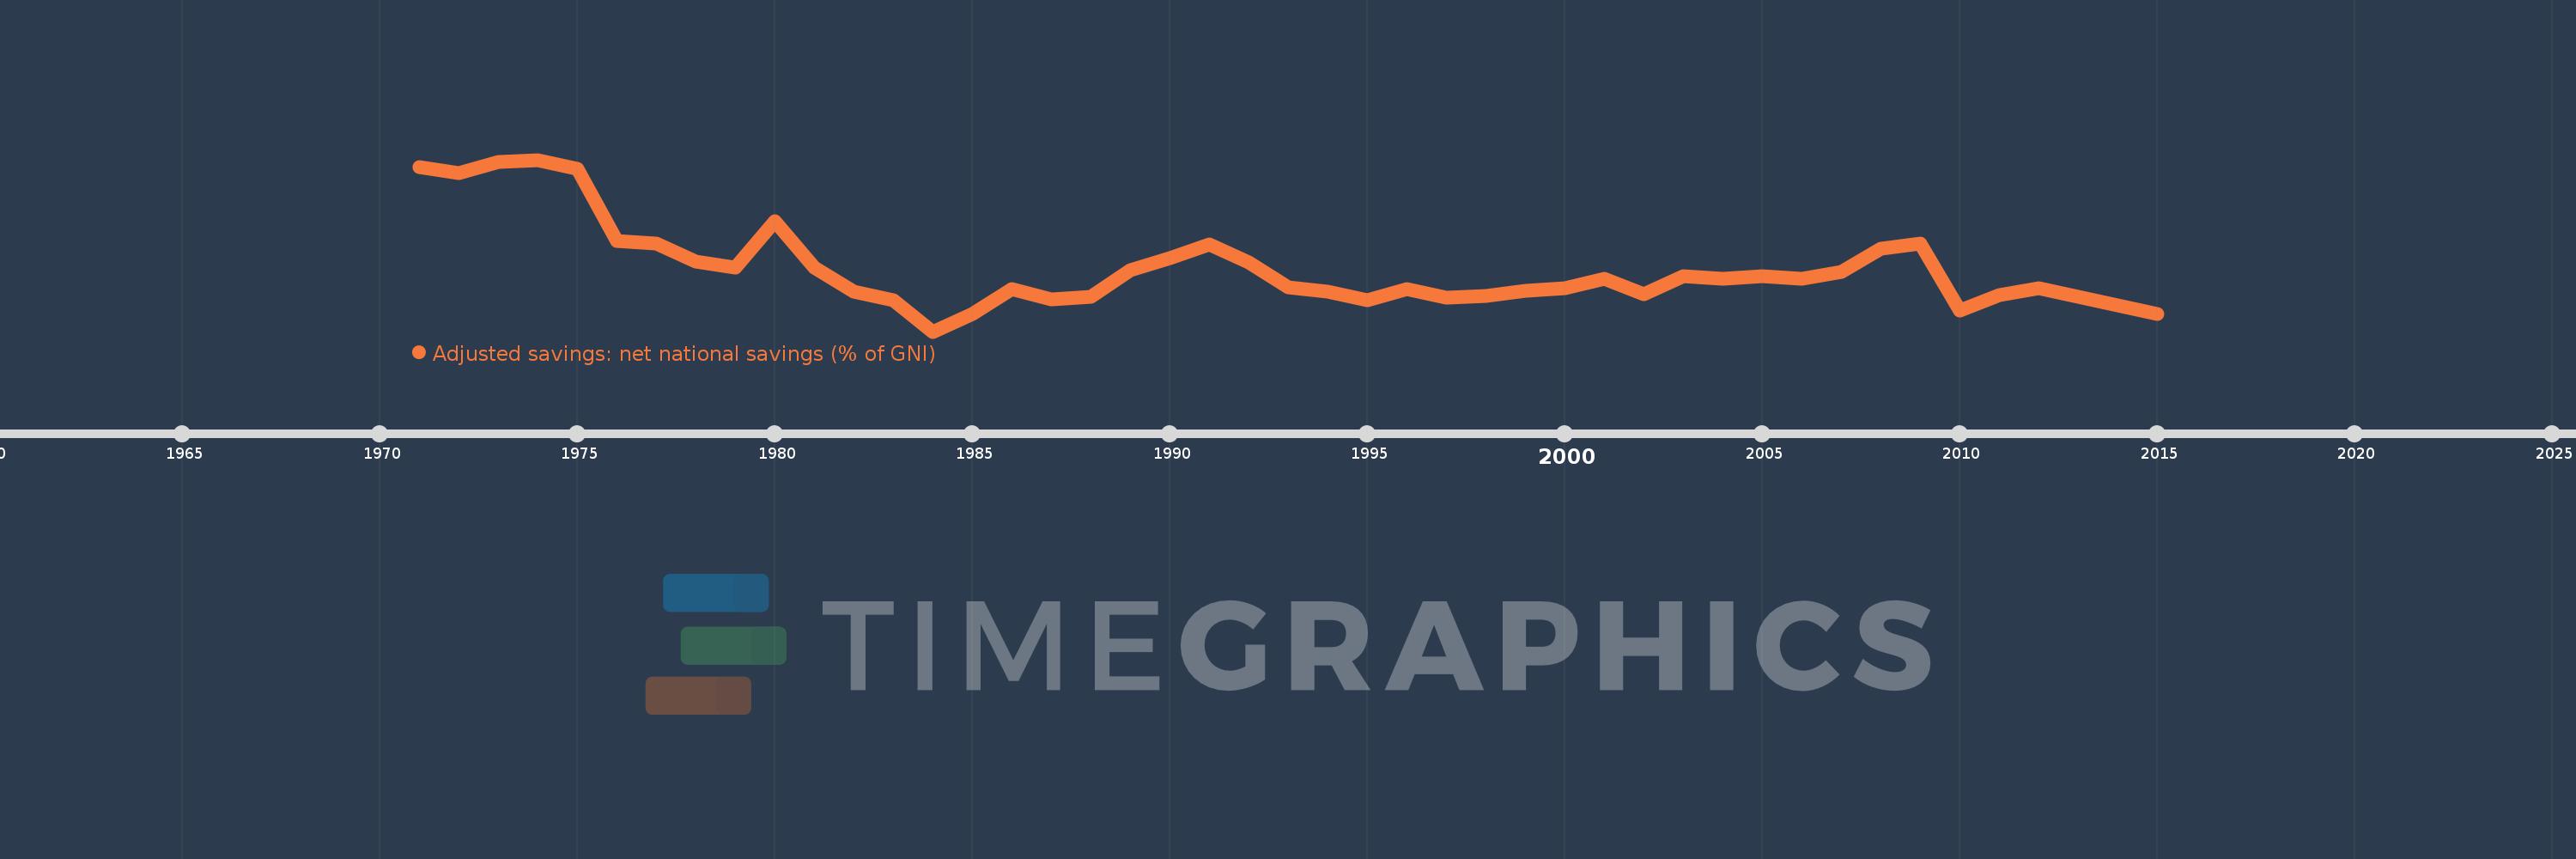
Adjusted savings: net national savings (% of GNI)
2015,2014,2013,2012,2011,2010,2009,2008,2007,2006,2005,2004,2003,2002,2001,2000,1999,1998,1997,1996,1995,1994,1993,1992,1991,1990,1989,1988,1987,1986,1985,1984,1983,1982,1981,1980,1979,1978,1977,1976,1975,1974,1973,1972,1971
This statistics in other country:
AfghanistanAlbaniaAlgeriaAngolaAntigua and BarbudaArab WorldArgentinaArmeniaAustraliaAustriaAzerbaijanBahamas, TheBahrainBangladeshBarbadosBelarusBelgiumBelizeBeninBermudaBhutanBoliviaBosnia and HerzegovinaBotswanaBrazilBrunei DarussalamBulgariaBurkina FasoBurundiCabo VerdeCambodiaCameroonCanadaCaribbean small statesCentral African RepublicCentral Europe and the BalticsChadChileChinaColombiaComorosCongo, Dem. Rep.Congo, Rep.Costa RicaCote d'IvoireCroatiaCyprusCzech RepublicDenmarkDjiboutiDominicaDominican RepublicEarly-demographic dividendEast Asia & PacificEast Asia & Pacific (excluding high income)East Asia & Pacific (IDA & IBRD countries)EcuadorEgypt, Arab Rep.El SalvadorEquatorial GuineaEritreaEstoniaEthiopiaEuro areaEurope & Central AsiaEurope & Central Asia (excluding high income)Europe & Central Asia (IDA & IBRD countries)European UnionFijiFinlandFragile and conflict affected situationsFranceGabonGambia, TheGeorgiaGermanyGhanaGreeceGrenadaGuatemalaGuineaGuinea-BissauGuyanaHaitiHeavily indebted poor countries (HIPC)High incomeHondurasHong Kong SAR, ChinaHungaryIBRD onlyIcelandIDA & IBRD totalIDA blendIDA onlyIDA totalIndiaIndonesiaIran, Islamic Rep.IraqIrelandIsraelItalyJamaicaJapanJordanKazakhstanKenyaKiribatiKorea, Rep.KosovoKuwaitKyrgyz RepublicLao PDRLate-demographic dividendLatin America & Caribbean Latin America & Caribbean (excluding high income)Latin America & the Caribbean (IDA & IBRD countries)LatviaLeast developed countries: UN classificationLebanonLesothoLiberiaLibyaLithuaniaLow & middle incomeLow incomeLower middle incomeLuxembourgMacao SAR, ChinaMacedonia, FYRMadagascarMalawiMalaysiaMaldivesMaliMaltaMauritaniaMauritiusMexicoMiddle East & North AfricaMiddle East & North Africa (excluding high income)Middle East & North Africa (IDA & IBRD countries)Middle incomeMoldovaMongoliaMontenegroMoroccoMozambiqueNamibiaNepalNetherlandsNew ZealandNicaraguaNigerNigeriaNorth AmericaNorwayOECD membersOmanOther small statesPacific island small statesPakistanPanamaPapua New GuineaParaguayPeruPhilippinesPolandPortugalPost-demographic dividendPre-demographic dividendQatarRomaniaRussian FederationRwandaSaudi ArabiaSenegalSerbiaSeychellesSierra LeoneSingaporeSlovak RepublicSloveniaSmall statesSolomon IslandsSouth AfricaSouth AsiaSouth Asia (IDA & IBRD)SpainSri LankaSt. Kitts and NevisSt. LuciaSt. Vincent and the GrenadinesSub-Saharan Africa Sub-Saharan Africa (excluding high income)Sub-Saharan Africa (IDA & IBRD countries)SudanSurinameSwazilandSwedenSwitzerlandSyrian Arab RepublicTajikistanTanzaniaThailandTimor-LesteTogoTongaTrinidad and TobagoTunisiaTurkeyTurkmenistanUgandaUkraineUnited KingdomUnited StatesUpper middle incomeUruguayVanuatuVenezuela, RBVietnamWest Bank and GazaWorldYemen, Rep.ZambiaZimbabwe Timeline:
This timeline shows a graph from 1971 to 2015 of Austria. No data until 1970. Number of actual observations by date: 45.
Source name:
World Development Indicators
Source organization:
World Bank staff estimates based on sources and methods in World Bank's "The Changing Wealth of Nations: Measuring Sustainable Development in the New Millennium" (2011).
Categories, topics:
Economy & Growth, Environment
Last updated:
apr 23, 2017
Indicators value changes by year
At the date of observation
Value
Absolute change
Change from previous value
jan 1, 1971
16.587
+16.587
0.0%
jan 1, 1972
16.189
-0.398
-2.4%
jan 1, 1973
16.877
+0.687
4.25%
jan 1, 1974
17.04
+0.163
0.97%
jan 1, 1975
16.434
-0.606
-3.56%
jan 1, 1976
11.746
-4.688
-28.53%
jan 1, 1977
11.588
-0.158
-1.34%
jan 1, 1978
10.439
-1.149
-9.92%
jan 1, 1979
10.043
-0.396
-3.79%
jan 1, 1980
13.05
+3.007
29.94%
jan 1, 1981
10.012
-3.038
-23.28%
jan 1, 1982
8.481
-1.531
-15.29%
jan 1, 1983
7.91
-0.571
-6.73%
jan 1, 1984
5.854
-2.056
-25.99%
jan 1, 1985
6.988
+1.134
19.38%
jan 1, 1986
8.644
+1.656
23.69%
jan 1, 1987
7.942
-0.702
-8.13%
jan 1, 1988
8.134
+0.192
2.42%
jan 1, 1989
9.828
+1.694
20.83%
jan 1, 1990
10.61
+0.782
7.96%
jan 1, 1991
11.515
+0.905
8.53%
jan 1, 1992
10.366
-1.149
-9.98%
jan 1, 1993
8.747
-1.619
-15.62%
jan 1, 1994
8.451
-0.296
-3.38%
jan 1, 1995
7.885
-0.566
-6.69%
jan 1, 1996
8.605
+0.72
9.13%
jan 1, 1997
8.068
-0.537
-6.24%
jan 1, 1998
8.154
+0.086
1.07%
jan 1, 1999
8.5
+0.346
4.24%
jan 1, 2000
8.682
+0.182
2.14%
jan 1, 2001
9.283
+0.6
6.91%
jan 1, 2002
8.283
-1.0
-10.77%
jan 1, 2003
9.434
+1.151
13.89%
jan 1, 2004
9.308
-0.125
-1.33%
jan 1, 2005
9.475
+0.167
1.79%
jan 1, 2006
9.291
-0.184
-1.95%
jan 1, 2007
9.725
+0.434
4.67%
jan 1, 2008
11.266
+1.541
15.85%
jan 1, 2009
11.586
+0.32
2.84%
jan 1, 2010
7.229
-4.357
-37.61%
jan 1, 2011
8.218
+0.989
13.69%
jan 1, 2012
8.705
+0.486
5.92%
jan 1, 2013
8.111
-0.593
-6.82%
jan 1, 2014
7.565
-0.546
-6.73%
jan 1, 2015
6.975
-0.591
-7.81%
Ranking of countries by current statistics by years


Comments: