29
/
en
AIzaSyAYiBZKx7MnpbEhh9jyipgxe19OcubqV5w
April 1, 2024
61321
Upper middle income
UMC
false
2
1
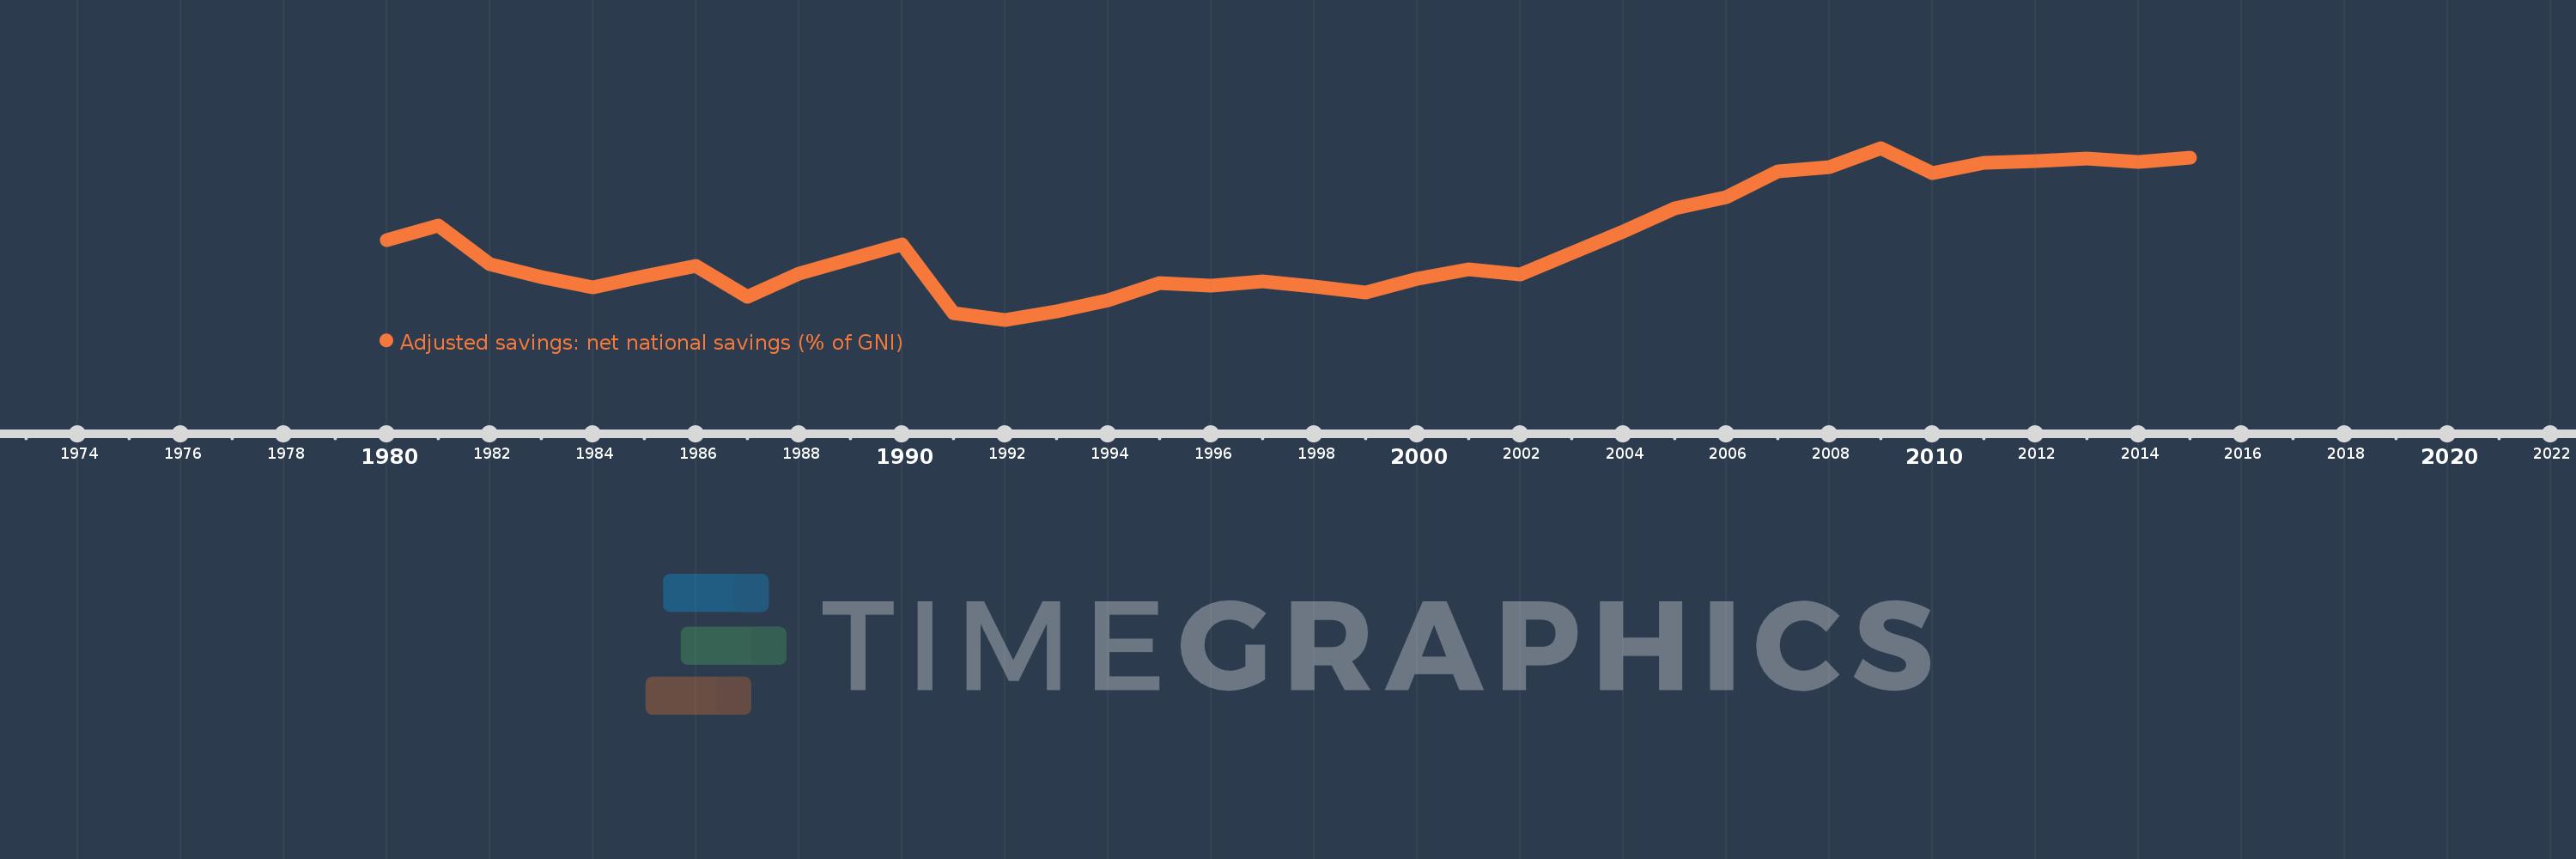
Adjusted savings: net national savings (% of GNI)
2015,2014,2013,2012,2011,2010,2009,2008,2007,2006,2005,2004,2003,2002,2001,2000,1999,1998,1997,1996,1995,1994,1993,1992,1991,1990,1988,1987,1986,1985,1984,1983,1982,1981,1980
This statistics in other country:
AfghanistanAlbaniaAlgeriaAngolaAntigua and BarbudaArab WorldArgentinaArmeniaAustraliaAustriaAzerbaijanBahamas, TheBahrainBangladeshBarbadosBelarusBelgiumBelizeBeninBermudaBhutanBoliviaBosnia and HerzegovinaBotswanaBrazilBrunei DarussalamBulgariaBurkina FasoBurundiCabo VerdeCambodiaCameroonCanadaCaribbean small statesCentral African RepublicCentral Europe and the BalticsChadChileChinaColombiaComorosCongo, Dem. Rep.Congo, Rep.Costa RicaCote d'IvoireCroatiaCyprusCzech RepublicDenmarkDjiboutiDominicaDominican RepublicEarly-demographic dividendEast Asia & PacificEast Asia & Pacific (excluding high income)East Asia & Pacific (IDA & IBRD countries)EcuadorEgypt, Arab Rep.El SalvadorEquatorial GuineaEritreaEstoniaEthiopiaEuro areaEurope & Central AsiaEurope & Central Asia (excluding high income)Europe & Central Asia (IDA & IBRD countries)European UnionFijiFinlandFragile and conflict affected situationsFranceGabonGambia, TheGeorgiaGermanyGhanaGreeceGrenadaGuatemalaGuineaGuinea-BissauGuyanaHaitiHeavily indebted poor countries (HIPC)High incomeHondurasHong Kong SAR, ChinaHungaryIBRD onlyIcelandIDA & IBRD totalIDA blendIDA onlyIDA totalIndiaIndonesiaIran, Islamic Rep.IraqIrelandIsraelItalyJamaicaJapanJordanKazakhstanKenyaKiribatiKorea, Rep.KosovoKuwaitKyrgyz RepublicLao PDRLate-demographic dividendLatin America & Caribbean Latin America & Caribbean (excluding high income)Latin America & the Caribbean (IDA & IBRD countries)LatviaLeast developed countries: UN classificationLebanonLesothoLiberiaLibyaLithuaniaLow & middle incomeLow incomeLower middle incomeLuxembourgMacao SAR, ChinaMacedonia, FYRMadagascarMalawiMalaysiaMaldivesMaliMaltaMauritaniaMauritiusMexicoMiddle East & North AfricaMiddle East & North Africa (excluding high income)Middle East & North Africa (IDA & IBRD countries)Middle incomeMoldovaMongoliaMontenegroMoroccoMozambiqueNamibiaNepalNetherlandsNew ZealandNicaraguaNigerNigeriaNorth AmericaNorwayOECD membersOmanOther small statesPacific island small statesPakistanPanamaPapua New GuineaParaguayPeruPhilippinesPolandPortugalPost-demographic dividendPre-demographic dividendQatarRomaniaRussian FederationRwandaSaudi ArabiaSenegalSerbiaSeychellesSierra LeoneSingaporeSlovak RepublicSloveniaSmall statesSolomon IslandsSouth AfricaSouth AsiaSouth Asia (IDA & IBRD)SpainSri LankaSt. Kitts and NevisSt. LuciaSt. Vincent and the GrenadinesSub-Saharan Africa Sub-Saharan Africa (excluding high income)Sub-Saharan Africa (IDA & IBRD countries)SudanSurinameSwazilandSwedenSwitzerlandSyrian Arab RepublicTajikistanTanzaniaThailandTimor-LesteTogoTongaTrinidad and TobagoTunisiaTurkeyTurkmenistanUgandaUkraineUnited KingdomUnited StatesUpper middle incomeUruguayVanuatuVenezuela, RBVietnamWest Bank and GazaWorldYemen, Rep.ZambiaZimbabwe Timeline:
This timeline shows a graph from 1980 to 2015 of Upper middle income. No data until 1979. Number of actual observations by date: 35.
Source name:
World Development Indicators
Source organization:
World Bank staff estimates based on sources and methods in World Bank's "The Changing Wealth of Nations: Measuring Sustainable Development in the New Millennium" (2011).
Categories, topics:
Economy & Growth, Environment
Last updated:
apr 23, 2017
Indicators value changes by year
Maximum:
25.113
jan 1, 2009
At the date of observation
Value
Absolute change
Change from previous value
jan 1, 1980
16.961
+16.961
0.0%
jan 1, 1981
18.232
+1.271
7.49%
jan 1, 1982
14.791
-3.441
-18.88%
jan 1, 1983
13.617
-1.174
-7.93%
jan 1, 1984
12.766
-0.851
-6.25%
jan 1, 1985
13.717
+0.951
7.45%
jan 1, 1986
14.647
+0.93
6.78%
jan 1, 1987
11.923
-2.725
-18.6%
jan 1, 1988
13.962
+2.04
17.11%
jan 1, 1990
16.541
+2.579
18.47%
jan 1, 1991
10.469
-6.072
-36.71%
jan 1, 1992
9.852
-0.616
-5.89%
jan 1, 1993
10.612
+0.759
7.71%
jan 1, 1994
11.621
+1.009
9.51%
jan 1, 1995
13.136
+1.515
13.03%
jan 1, 1996
12.847
-0.289
-2.2%
jan 1, 1997
13.243
+0.396
3.09%
jan 1, 1998
12.809
-0.434
-3.28%
jan 1, 1999
12.261
-0.548
-4.28%
jan 1, 2000
13.525
+1.265
10.31%
jan 1, 2001
14.317
+0.792
5.86%
jan 1, 2002
13.885
-0.432
-3.02%
jan 1, 2003
15.793
+1.908
13.74%
jan 1, 2004
17.689
+1.895
12.0%
jan 1, 2005
19.728
+2.039
11.53%
jan 1, 2006
20.715
+0.987
5.0%
jan 1, 2007
23.064
+2.35
11.34%
jan 1, 2008
23.419
+0.355
1.54%
jan 1, 2009
25.113
+1.694
7.23%
jan 1, 2010
22.87
-2.243
-8.93%
jan 1, 2011
23.794
+0.925
4.04%
jan 1, 2012
23.915
+0.121
0.51%
jan 1, 2013
24.168
+0.253
1.06%
jan 1, 2014
23.883
-0.285
-1.18%
jan 1, 2015
24.267
+0.383
1.61%
Ranking of countries by current statistics by years


Comments: