29
/
en
AIzaSyAYiBZKx7MnpbEhh9jyipgxe19OcubqV5w
April 1, 2024
93202
Bulgaria
BGR
true
2
1
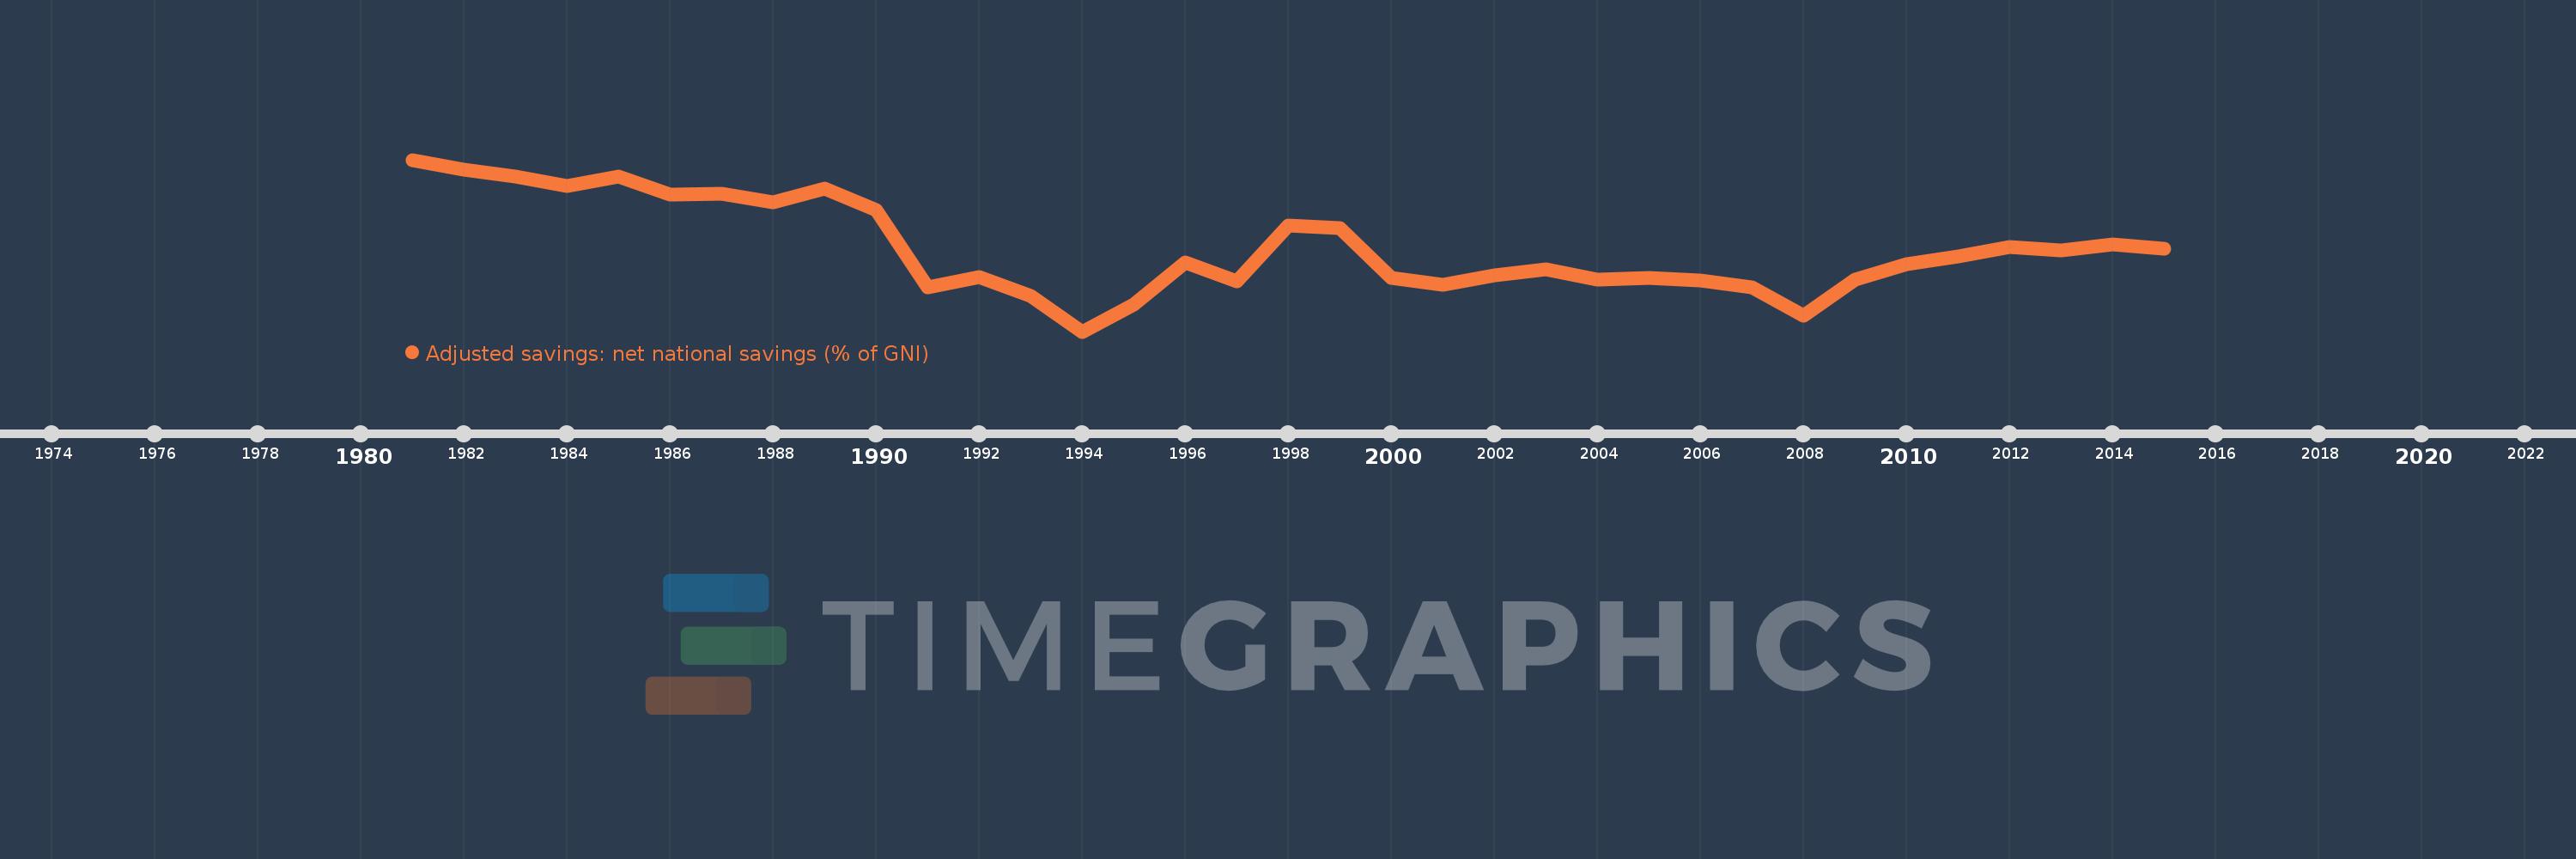
Adjusted savings: net national savings (% of GNI)
2015,2014,2013,2012,2011,2010,2009,2008,2007,2006,2005,2004,2003,2002,2001,2000,1999,1998,1997,1996,1995,1994,1993,1992,1991,1990,1989,1988,1987,1986,1985,1984,1983,1982,1981
This statistics in other country:
AfghanistanAlbaniaAlgeriaAngolaAntigua and BarbudaArab WorldArgentinaArmeniaAustraliaAustriaAzerbaijanBahamas, TheBahrainBangladeshBarbadosBelarusBelgiumBelizeBeninBermudaBhutanBoliviaBosnia and HerzegovinaBotswanaBrazilBrunei DarussalamBulgariaBurkina FasoBurundiCabo VerdeCambodiaCameroonCanadaCaribbean small statesCentral African RepublicCentral Europe and the BalticsChadChileChinaColombiaComorosCongo, Dem. Rep.Congo, Rep.Costa RicaCote d'IvoireCroatiaCyprusCzech RepublicDenmarkDjiboutiDominicaDominican RepublicEarly-demographic dividendEast Asia & PacificEast Asia & Pacific (excluding high income)East Asia & Pacific (IDA & IBRD countries)EcuadorEgypt, Arab Rep.El SalvadorEquatorial GuineaEritreaEstoniaEthiopiaEuro areaEurope & Central AsiaEurope & Central Asia (excluding high income)Europe & Central Asia (IDA & IBRD countries)European UnionFijiFinlandFragile and conflict affected situationsFranceGabonGambia, TheGeorgiaGermanyGhanaGreeceGrenadaGuatemalaGuineaGuinea-BissauGuyanaHaitiHeavily indebted poor countries (HIPC)High incomeHondurasHong Kong SAR, ChinaHungaryIBRD onlyIcelandIDA & IBRD totalIDA blendIDA onlyIDA totalIndiaIndonesiaIran, Islamic Rep.IraqIrelandIsraelItalyJamaicaJapanJordanKazakhstanKenyaKiribatiKorea, Rep.KosovoKuwaitKyrgyz RepublicLao PDRLate-demographic dividendLatin America & Caribbean Latin America & Caribbean (excluding high income)Latin America & the Caribbean (IDA & IBRD countries)LatviaLeast developed countries: UN classificationLebanonLesothoLiberiaLibyaLithuaniaLow & middle incomeLow incomeLower middle incomeLuxembourgMacao SAR, ChinaMacedonia, FYRMadagascarMalawiMalaysiaMaldivesMaliMaltaMauritaniaMauritiusMexicoMiddle East & North AfricaMiddle East & North Africa (excluding high income)Middle East & North Africa (IDA & IBRD countries)Middle incomeMoldovaMongoliaMontenegroMoroccoMozambiqueNamibiaNepalNetherlandsNew ZealandNicaraguaNigerNigeriaNorth AmericaNorwayOECD membersOmanOther small statesPacific island small statesPakistanPanamaPapua New GuineaParaguayPeruPhilippinesPolandPortugalPost-demographic dividendPre-demographic dividendQatarRomaniaRussian FederationRwandaSaudi ArabiaSenegalSerbiaSeychellesSierra LeoneSingaporeSlovak RepublicSloveniaSmall statesSolomon IslandsSouth AfricaSouth AsiaSouth Asia (IDA & IBRD)SpainSri LankaSt. Kitts and NevisSt. LuciaSt. Vincent and the GrenadinesSub-Saharan Africa Sub-Saharan Africa (excluding high income)Sub-Saharan Africa (IDA & IBRD countries)SudanSurinameSwazilandSwedenSwitzerlandSyrian Arab RepublicTajikistanTanzaniaThailandTimor-LesteTogoTongaTrinidad and TobagoTunisiaTurkeyTurkmenistanUgandaUkraineUnited KingdomUnited StatesUpper middle incomeUruguayVanuatuVenezuela, RBVietnamWest Bank and GazaWorldYemen, Rep.ZambiaZimbabwe Timeline:
This timeline shows a graph from 1981 to 2015 of Bulgaria. No data until 1980. Number of actual observations by date: 35.
Source name:
World Development Indicators
Source organization:
World Bank staff estimates based on sources and methods in World Bank's "The Changing Wealth of Nations: Measuring Sustainable Development in the New Millennium" (2011).
Categories, topics:
Economy & Growth, Environment
Last updated:
apr 23, 2017
Indicators value changes by year
Minimum:
-7.475
jan 1, 1994
Maximum:
27.432
jan 1, 1981
At the date of observation
Value
Absolute change
Change from previous value
jan 1, 1981
27.432
+27.432
0.0%
jan 1, 1982
25.432
-2.0
-7.29%
jan 1, 1983
24.013
-1.419
-5.58%
jan 1, 1984
22.148
-1.865
-7.76%
jan 1, 1985
24.024
+1.875
8.47%
jan 1, 1986
20.355
-3.669
-15.27%
jan 1, 1987
20.566
+0.211
1.04%
jan 1, 1988
18.8
-1.766
-8.59%
jan 1, 1989
21.531
+2.731
14.53%
jan 1, 1990
17.175
-4.356
-20.23%
jan 1, 1991
1.519
-15.656
-91.16%
jan 1, 1992
3.588
+2.069
136.25%
jan 1, 1993
-0.242
-3.83
-106.74%
jan 1, 1994
-7.475
-7.233
2.99K%
jan 1, 1995
-2.011
+5.464
-73.1%
jan 1, 1996
6.634
+8.645
-429.91%
jan 1, 1997
2.695
-3.939
-59.37%
jan 1, 1998
14.157
+11.462
425.22%
jan 1, 1999
13.512
-0.645
-4.56%
jan 1, 2000
3.473
-10.039
-74.3%
jan 1, 2001
2.052
-1.421
-40.92%
jan 1, 2002
3.903
+1.85
90.17%
jan 1, 2003
5.192
+1.289
33.04%
jan 1, 2004
3.131
-2.061
-39.69%
jan 1, 2005
3.483
+0.352
11.23%
jan 1, 2006
2.844
-0.639
-18.34%
jan 1, 2007
1.59
-1.255
-44.11%
jan 1, 2008
-4.261
-5.851
-368.09%
jan 1, 2009
3.126
+7.387
-173.35%
jan 1, 2010
6.206
+3.081
98.56%
jan 1, 2011
7.847
+1.641
26.44%
jan 1, 2012
9.677
+1.829
23.31%
jan 1, 2013
8.936
-0.741
-7.66%
jan 1, 2014
10.178
+1.242
13.9%
jan 1, 2015
9.355
-0.822
-8.08%
Ranking of countries by current statistics by years


Comments: