29
/
en
AIzaSyAYiBZKx7MnpbEhh9jyipgxe19OcubqV5w
April 1, 2024
146518
Guinea-Bissau
GNB
true
2
1
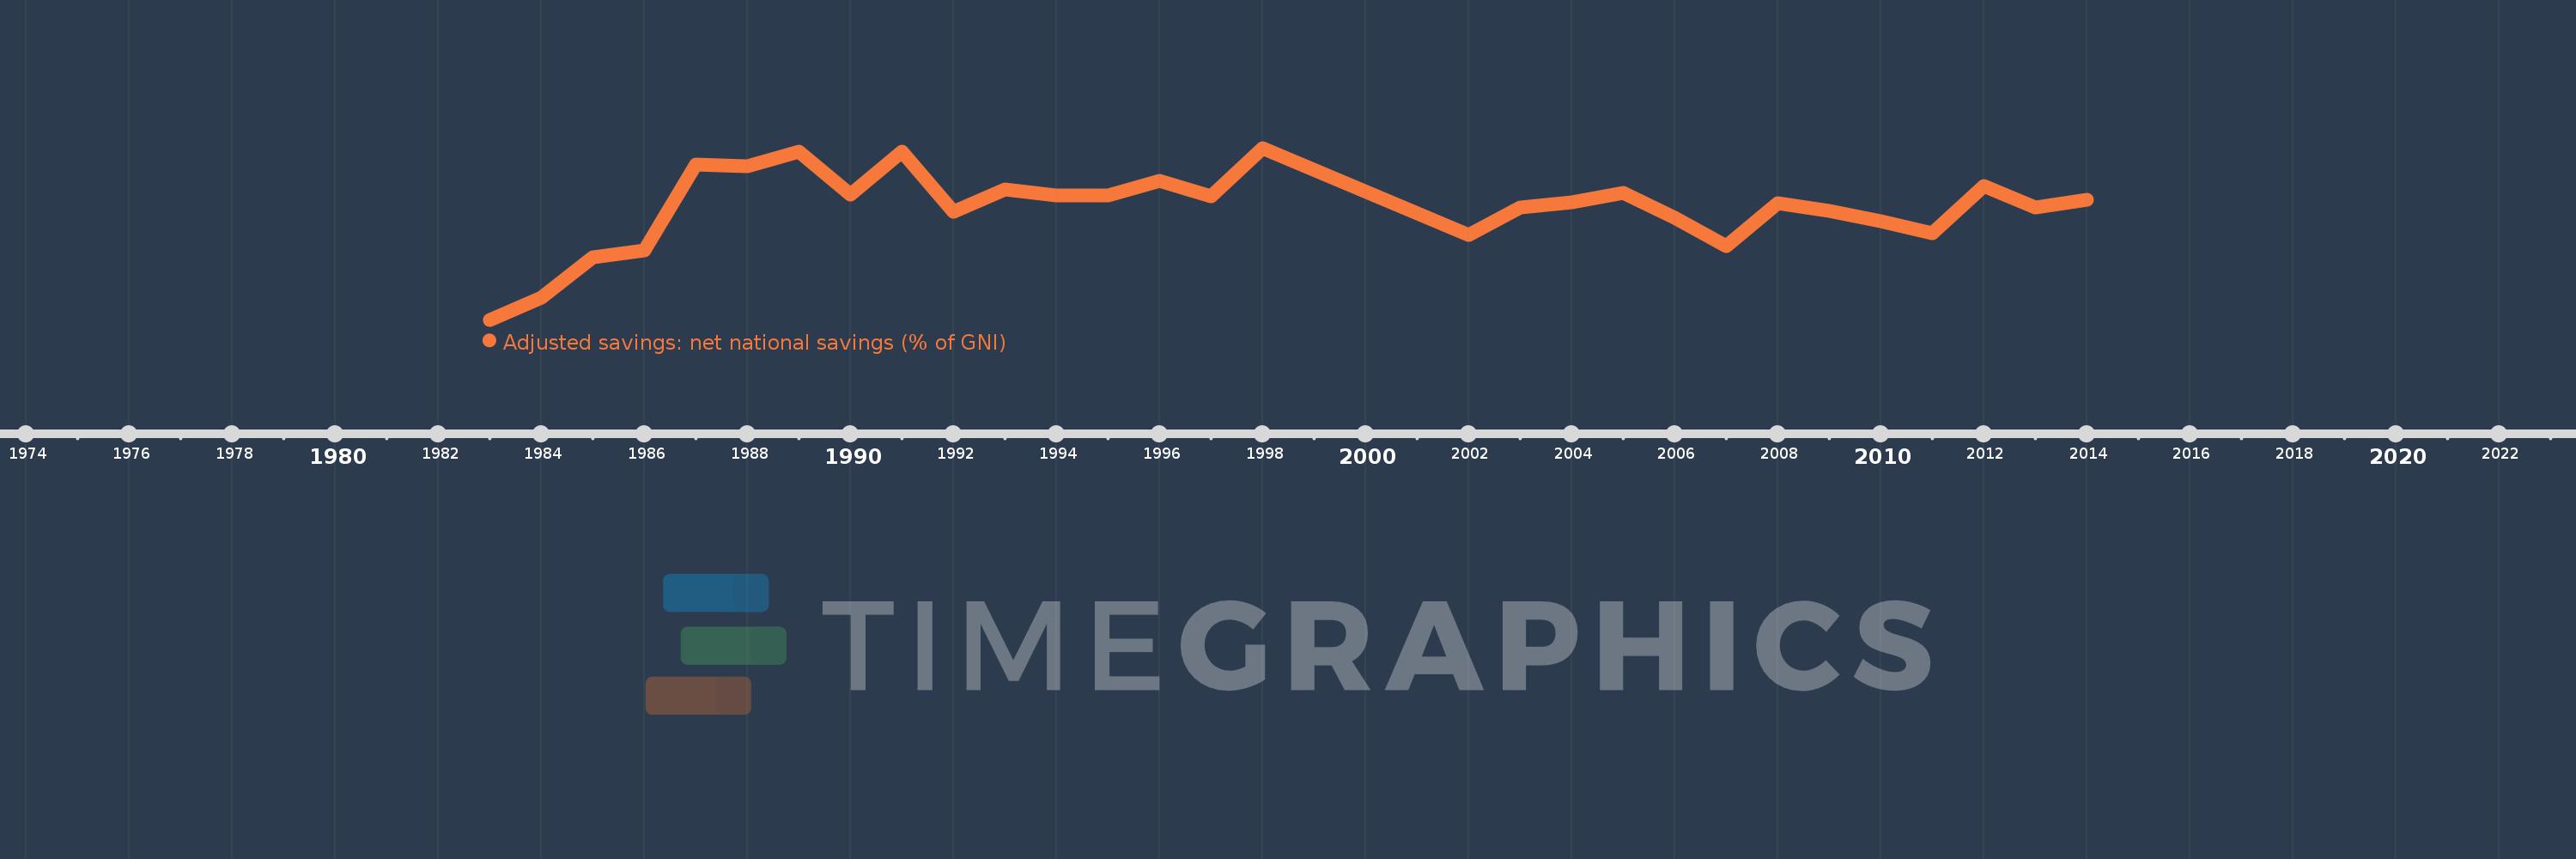
Adjusted savings: net national savings (% of GNI)
2014,2013,2012,2011,2010,2009,2008,2007,2006,2005,2004,2003,2002,1998,1997,1996,1995,1994,1993,1992,1991,1990,1989,1988,1987,1986,1985,1984,1983
This statistics in other country:
AfghanistanAlbaniaAlgeriaAngolaAntigua and BarbudaArab WorldArgentinaArmeniaAustraliaAustriaAzerbaijanBahamas, TheBahrainBangladeshBarbadosBelarusBelgiumBelizeBeninBermudaBhutanBoliviaBosnia and HerzegovinaBotswanaBrazilBrunei DarussalamBulgariaBurkina FasoBurundiCabo VerdeCambodiaCameroonCanadaCaribbean small statesCentral African RepublicCentral Europe and the BalticsChadChileChinaColombiaComorosCongo, Dem. Rep.Congo, Rep.Costa RicaCote d'IvoireCroatiaCyprusCzech RepublicDenmarkDjiboutiDominicaDominican RepublicEarly-demographic dividendEast Asia & PacificEast Asia & Pacific (excluding high income)East Asia & Pacific (IDA & IBRD countries)EcuadorEgypt, Arab Rep.El SalvadorEquatorial GuineaEritreaEstoniaEthiopiaEuro areaEurope & Central AsiaEurope & Central Asia (excluding high income)Europe & Central Asia (IDA & IBRD countries)European UnionFijiFinlandFragile and conflict affected situationsFranceGabonGambia, TheGeorgiaGermanyGhanaGreeceGrenadaGuatemalaGuineaGuinea-BissauGuyanaHaitiHeavily indebted poor countries (HIPC)High incomeHondurasHong Kong SAR, ChinaHungaryIBRD onlyIcelandIDA & IBRD totalIDA blendIDA onlyIDA totalIndiaIndonesiaIran, Islamic Rep.IraqIrelandIsraelItalyJamaicaJapanJordanKazakhstanKenyaKiribatiKorea, Rep.KosovoKuwaitKyrgyz RepublicLao PDRLate-demographic dividendLatin America & Caribbean Latin America & Caribbean (excluding high income)Latin America & the Caribbean (IDA & IBRD countries)LatviaLeast developed countries: UN classificationLebanonLesothoLiberiaLibyaLithuaniaLow & middle incomeLow incomeLower middle incomeLuxembourgMacao SAR, ChinaMacedonia, FYRMadagascarMalawiMalaysiaMaldivesMaliMaltaMauritaniaMauritiusMexicoMiddle East & North AfricaMiddle East & North Africa (excluding high income)Middle East & North Africa (IDA & IBRD countries)Middle incomeMoldovaMongoliaMontenegroMoroccoMozambiqueNamibiaNepalNetherlandsNew ZealandNicaraguaNigerNigeriaNorth AmericaNorwayOECD membersOmanOther small statesPacific island small statesPakistanPanamaPapua New GuineaParaguayPeruPhilippinesPolandPortugalPost-demographic dividendPre-demographic dividendQatarRomaniaRussian FederationRwandaSaudi ArabiaSenegalSerbiaSeychellesSierra LeoneSingaporeSlovak RepublicSloveniaSmall statesSolomon IslandsSouth AfricaSouth AsiaSouth Asia (IDA & IBRD)SpainSri LankaSt. Kitts and NevisSt. LuciaSt. Vincent and the GrenadinesSub-Saharan Africa Sub-Saharan Africa (excluding high income)Sub-Saharan Africa (IDA & IBRD countries)SudanSurinameSwazilandSwedenSwitzerlandSyrian Arab RepublicTajikistanTanzaniaThailandTimor-LesteTogoTongaTrinidad and TobagoTunisiaTurkeyTurkmenistanUgandaUkraineUnited KingdomUnited StatesUpper middle incomeUruguayVanuatuVenezuela, RBVietnamWest Bank and GazaWorldYemen, Rep.ZambiaZimbabwe Timeline:
This timeline shows a graph from 1983 to 2014 of Guinea-Bissau. No data until 1982. Number of actual observations by date: 29.
Source name:
World Development Indicators
Source organization:
World Bank staff estimates based on sources and methods in World Bank's "The Changing Wealth of Nations: Measuring Sustainable Development in the New Millennium" (2011).
Categories, topics:
Economy & Growth, Environment
Last updated:
apr 23, 2017
Indicators value changes by year
Minimum:
-28.323
jan 1, 1983
At the date of observation
Value
Absolute change
Change from previous value
jan 1, 1983
-28.323
-28.323
0.0%
jan 1, 1984
-24.132
+4.191
-14.8%
jan 1, 1985
-16.51
+7.622
-31.58%
jan 1, 1986
-15.328
+1.182
-7.16%
jan 1, 1987
0.788
+16.116
-105.14%
jan 1, 1988
0.559
-0.229
-29.05%
jan 1, 1989
3.216
+2.656
474.93%
jan 1, 1990
-4.841
-8.057
-250.54%
jan 1, 1991
3.198
+8.039
-166.07%
jan 1, 1992
-7.98
-11.179
-349.52%
jan 1, 1993
-3.889
+4.092
-51.27%
jan 1, 1994
-4.998
-1.109
28.53%
jan 1, 1995
-4.9
+0.098
-1.97%
jan 1, 1996
-2.277
+2.623
-53.53%
jan 1, 1997
-5.198
-2.922
128.33%
jan 1, 1998
3.956
+9.154
-176.1%
jan 1, 2002
-12.313
-16.269
-411.29%
jan 1, 2003
-7.171
+5.143
-41.77%
jan 1, 2004
-6.259
+0.912
-12.72%
jan 1, 2005
-4.474
+1.785
-28.51%
jan 1, 2006
-9.181
-4.707
105.22%
jan 1, 2007
-14.557
-5.375
58.54%
jan 1, 2008
-6.45
+8.106
-55.69%
jan 1, 2009
-7.895
-1.445
22.4%
jan 1, 2010
-9.814
-1.919
24.31%
jan 1, 2011
-11.991
-2.177
22.19%
jan 1, 2012
-3.122
+8.87
-73.97%
jan 1, 2013
-7.152
-4.031
129.11%
jan 1, 2014
-5.771
+1.381
-19.31%
Ranking of countries by current statistics by years


Comments: