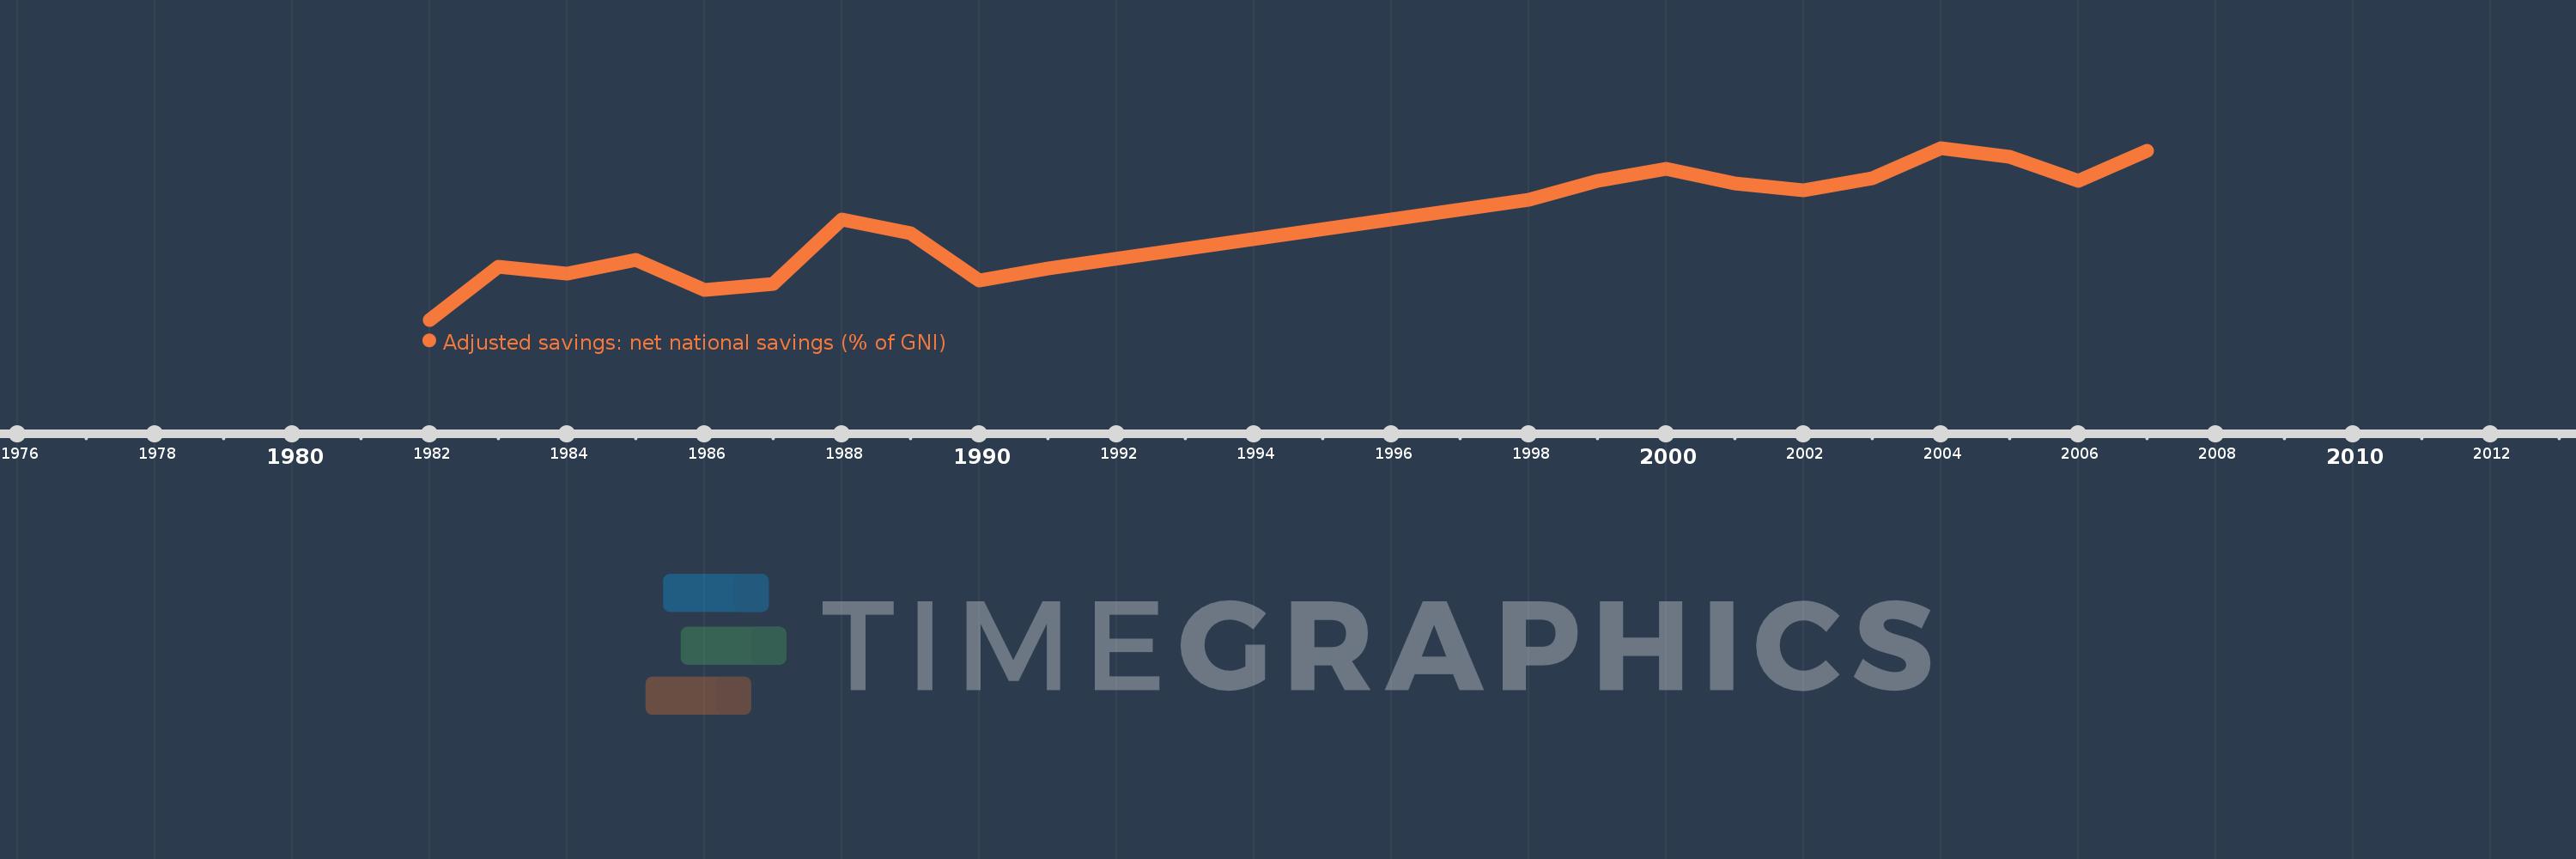
This timeline shows a graph from 1982 to 2007 of Solomon Islands. No data until 1981. Number of actual observations by date: 20.
Source name:
World Development Indicators
Source organization:
World Bank staff estimates based on sources and methods in World Bank's "The Changing Wealth of Nations: Measuring Sustainable Development in the New Millennium" (2011).
Categories, topics:
Economy & Growth, Environment
Last updated:
apr 23, 2017
Indicators value changes by year
Meaning:
-34.533
Minimum:
-85.813
jan 1, 1982
Maximum:
3.991
jan 1, 2004
At the date of observation
Value
Absolute change
Change from the previous value
jan 1, 1982
-85.813
-85.813
0.0%
jan 1, 1983
-58.135
+27.678
-32.25%
jan 1, 1984
-61.707
-3.572
6.15%
jan 1, 1985
-54.477
+7.23
-11.72%
jan 1, 1986
-70.423
-15.946
29.27%
jan 1, 1987
-66.973
+3.45
-4.9%
jan 1, 1988
-33.408
+33.565
-50.12%
jan 1, 1989
-40.517
-7.108
21.28%
jan 1, 1990
-65.079
-24.563
60.62%
jan 1, 1991
-58.949
+6.13
-9.42%
jan 1, 1998
-23.226
+35.723
-60.6%
jan 1, 1999
-13.018
+10.208
-43.95%
jan 1, 2000
-7.111
+5.907
-45.37%
jan 1, 2001
-14.738
-7.627
107.26%
jan 1, 2002
-18.104
-3.366
22.84%
jan 1, 2003
-11.756
+6.348
-35.06%
jan 1, 2004
3.991
+15.747
-133.94%
jan 1, 2005
-0.58
-4.571
-114.54%
jan 1, 2006
-12.994
-12.414
2.14K%
jan 1, 2007
2.356
+15.35
-118.13%
Ranking of countries by current statistics by years
