29
/
en
AIzaSyAYiBZKx7MnpbEhh9jyipgxe19OcubqV5w
April 1, 2024
138975
Germany
DEU
true
2
1
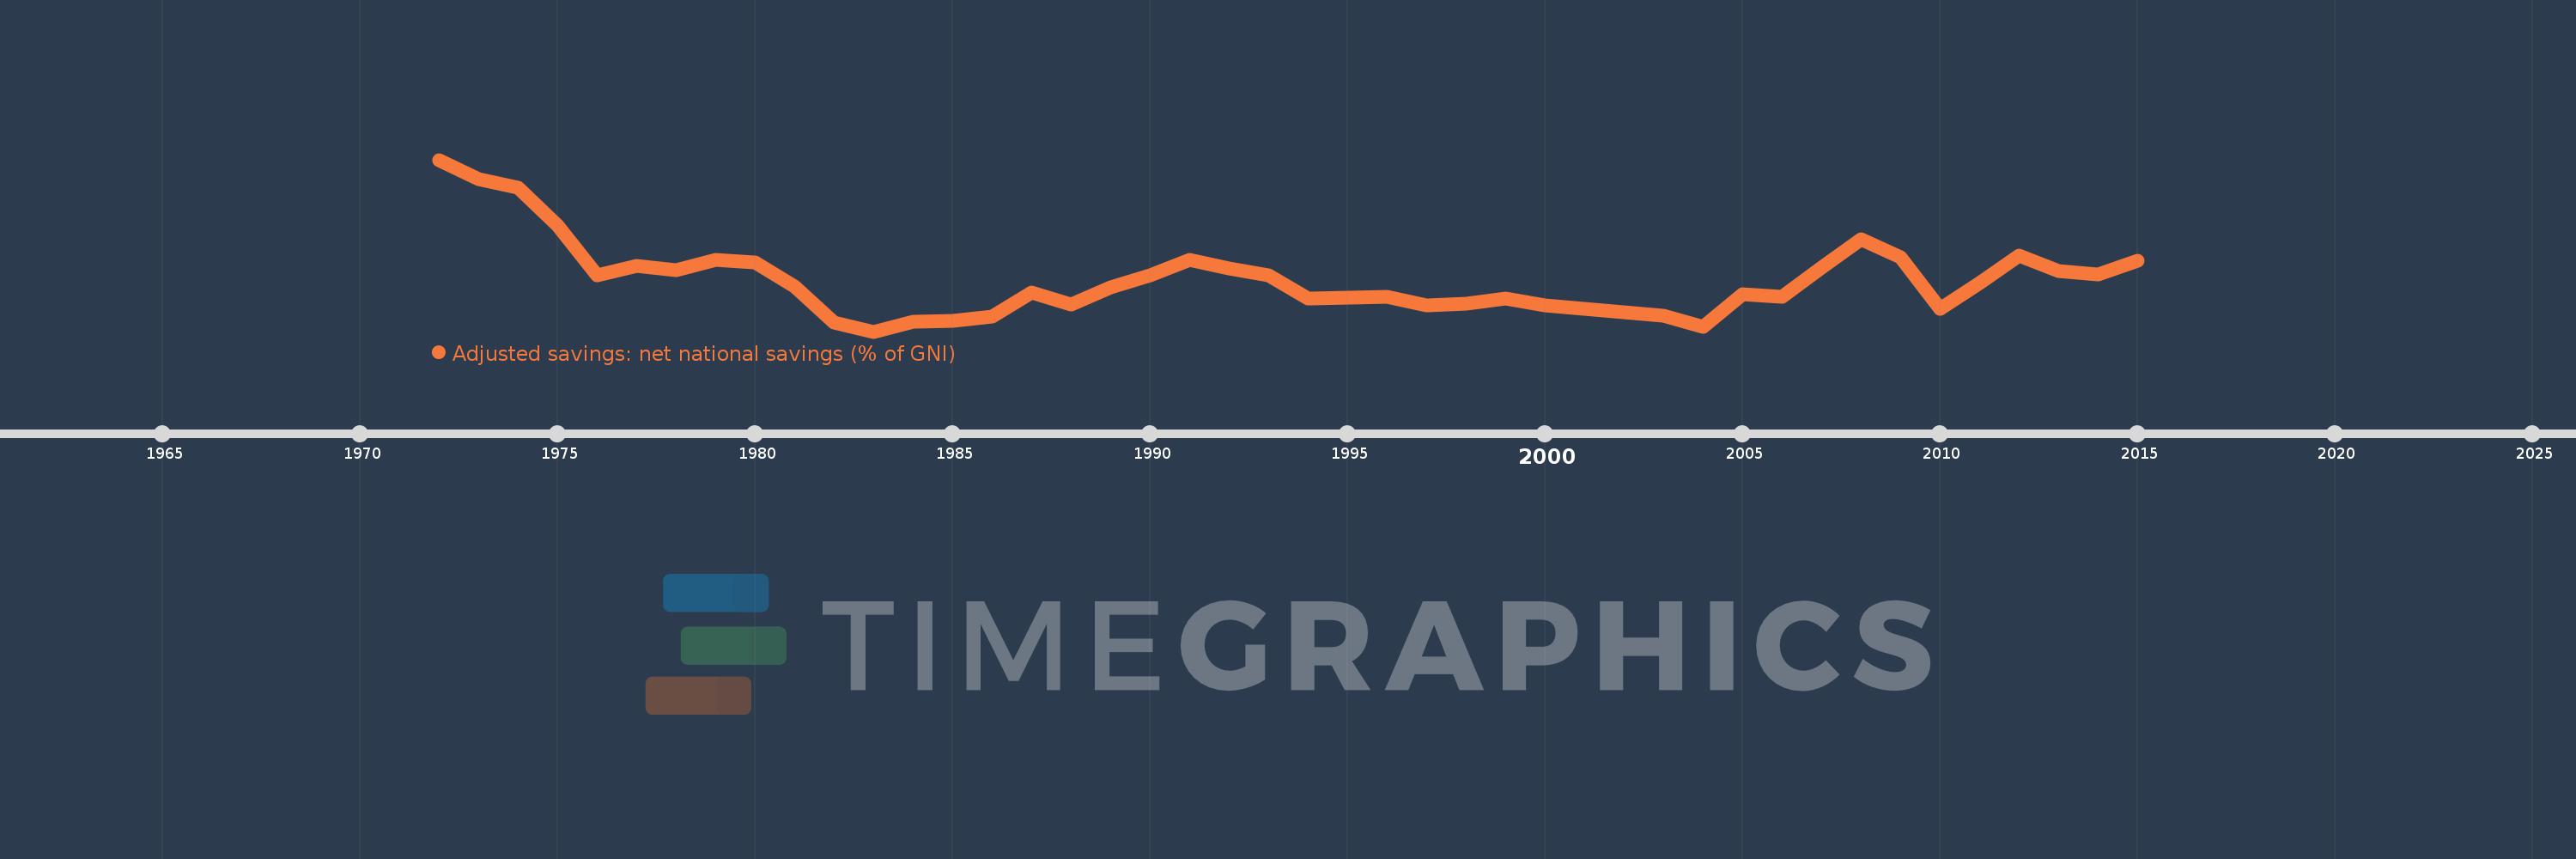
Adjusted savings: net national savings (% of GNI)
2015,2014,2013,2012,2011,2010,2009,2008,2007,2006,2005,2004,2003,2002,2001,2000,1999,1998,1997,1996,1995,1994,1993,1992,1991,1990,1989,1988,1987,1986,1985,1984,1983,1982,1981,1980,1979,1978,1977,1976,1975,1974,1973,1972
This statistics in other country:
AfghanistanAlbaniaAlgeriaAngolaAntigua and BarbudaArab WorldArgentinaArmeniaAustraliaAustriaAzerbaijanBahamas, TheBahrainBangladeshBarbadosBelarusBelgiumBelizeBeninBermudaBhutanBoliviaBosnia and HerzegovinaBotswanaBrazilBrunei DarussalamBulgariaBurkina FasoBurundiCabo VerdeCambodiaCameroonCanadaCaribbean small statesCentral African RepublicCentral Europe and the BalticsChadChileChinaColombiaComorosCongo, Dem. Rep.Congo, Rep.Costa RicaCote d'IvoireCroatiaCyprusCzech RepublicDenmarkDjiboutiDominicaDominican RepublicEarly-demographic dividendEast Asia & PacificEast Asia & Pacific (excluding high income)East Asia & Pacific (IDA & IBRD countries)EcuadorEgypt, Arab Rep.El SalvadorEquatorial GuineaEritreaEstoniaEthiopiaEuro areaEurope & Central AsiaEurope & Central Asia (excluding high income)Europe & Central Asia (IDA & IBRD countries)European UnionFijiFinlandFragile and conflict affected situationsFranceGabonGambia, TheGeorgiaGermanyGhanaGreeceGrenadaGuatemalaGuineaGuinea-BissauGuyanaHaitiHeavily indebted poor countries (HIPC)High incomeHondurasHong Kong SAR, ChinaHungaryIBRD onlyIcelandIDA & IBRD totalIDA blendIDA onlyIDA totalIndiaIndonesiaIran, Islamic Rep.IraqIrelandIsraelItalyJamaicaJapanJordanKazakhstanKenyaKiribatiKorea, Rep.KosovoKuwaitKyrgyz RepublicLao PDRLate-demographic dividendLatin America & Caribbean Latin America & Caribbean (excluding high income)Latin America & the Caribbean (IDA & IBRD countries)LatviaLeast developed countries: UN classificationLebanonLesothoLiberiaLibyaLithuaniaLow & middle incomeLow incomeLower middle incomeLuxembourgMacao SAR, ChinaMacedonia, FYRMadagascarMalawiMalaysiaMaldivesMaliMaltaMauritaniaMauritiusMexicoMiddle East & North AfricaMiddle East & North Africa (excluding high income)Middle East & North Africa (IDA & IBRD countries)Middle incomeMoldovaMongoliaMontenegroMoroccoMozambiqueNamibiaNepalNetherlandsNew ZealandNicaraguaNigerNigeriaNorth AmericaNorwayOECD membersOmanOther small statesPacific island small statesPakistanPanamaPapua New GuineaParaguayPeruPhilippinesPolandPortugalPost-demographic dividendPre-demographic dividendQatarRomaniaRussian FederationRwandaSaudi ArabiaSenegalSerbiaSeychellesSierra LeoneSingaporeSlovak RepublicSloveniaSmall statesSolomon IslandsSouth AfricaSouth AsiaSouth Asia (IDA & IBRD)SpainSri LankaSt. Kitts and NevisSt. LuciaSt. Vincent and the GrenadinesSub-Saharan Africa Sub-Saharan Africa (excluding high income)Sub-Saharan Africa (IDA & IBRD countries)SudanSurinameSwazilandSwedenSwitzerlandSyrian Arab RepublicTajikistanTanzaniaThailandTimor-LesteTogoTongaTrinidad and TobagoTunisiaTurkeyTurkmenistanUgandaUkraineUnited KingdomUnited StatesUpper middle incomeUruguayVanuatuVenezuela, RBVietnamWest Bank and GazaWorldYemen, Rep.ZambiaZimbabwe Timeline:
This timeline shows a graph from 1972 to 2015 of Germany. No data until 1971. Number of actual observations by date: 44.
Source name:
World Development Indicators
Source organization:
World Bank staff estimates based on sources and methods in World Bank's "The Changing Wealth of Nations: Measuring Sustainable Development in the New Millennium" (2011).
Categories, topics:
Economy & Growth, Environment
Last updated:
apr 23, 2017
Indicators value changes by year
Maximum:
16.472
jan 1, 1972
At the date of observation
Value
Absolute change
Change from previous value
jan 1, 1972
16.472
+16.472
0.0%
jan 1, 1973
15.023
-1.449
-8.8%
jan 1, 1974
14.369
-0.655
-4.36%
jan 1, 1975
11.57
-2.799
-19.48%
jan 1, 1976
7.903
-3.667
-31.69%
jan 1, 1977
8.573
+0.67
8.48%
jan 1, 1978
8.27
-0.303
-3.54%
jan 1, 1979
9.021
+0.751
9.09%
jan 1, 1980
8.827
-0.194
-2.15%
jan 1, 1981
7.017
-1.811
-20.51%
jan 1, 1982
4.333
-2.683
-38.24%
jan 1, 1983
3.692
-0.641
-14.79%
jan 1, 1984
4.44
+0.748
20.26%
jan 1, 1985
4.496
+0.055
1.24%
jan 1, 1986
4.799
+0.303
6.74%
jan 1, 1987
6.608
+1.809
37.69%
jan 1, 1988
5.731
-0.877
-13.27%
jan 1, 1989
6.951
+1.221
21.3%
jan 1, 1990
7.856
+0.904
13.01%
jan 1, 1991
8.999
+1.144
14.56%
jan 1, 1992
8.364
-0.636
-7.06%
jan 1, 1993
7.862
-0.502
-6.0%
jan 1, 1994
6.154
-1.708
-21.72%
jan 1, 1995
6.187
+0.033
0.53%
jan 1, 1996
6.279
+0.093
1.5%
jan 1, 1997
5.646
-0.634
-10.09%
jan 1, 1998
5.78
+0.135
2.39%
jan 1, 1999
6.182
+0.401
6.95%
jan 1, 2000
5.641
-0.541
-8.75%
jan 1, 2001
5.401
-0.24
-4.25%
jan 1, 2002
5.135
-0.266
-4.93%
jan 1, 2003
4.877
-0.258
-5.03%
jan 1, 2004
4.025
-0.852
-17.47%
jan 1, 2005
6.481
+2.456
61.01%
jan 1, 2006
6.269
-0.212
-3.27%
jan 1, 2007
8.468
+2.199
35.08%
jan 1, 2008
10.534
+2.066
24.4%
jan 1, 2009
9.193
-1.341
-12.73%
jan 1, 2010
5.372
-3.82
-41.56%
jan 1, 2011
7.278
+1.906
35.48%
jan 1, 2012
9.357
+2.079
28.56%
jan 1, 2013
8.203
-1.154
-12.33%
jan 1, 2014
7.954
-0.249
-3.04%
jan 1, 2015
8.978
+1.025
12.88%
Ranking of countries by current statistics by years


Comments: