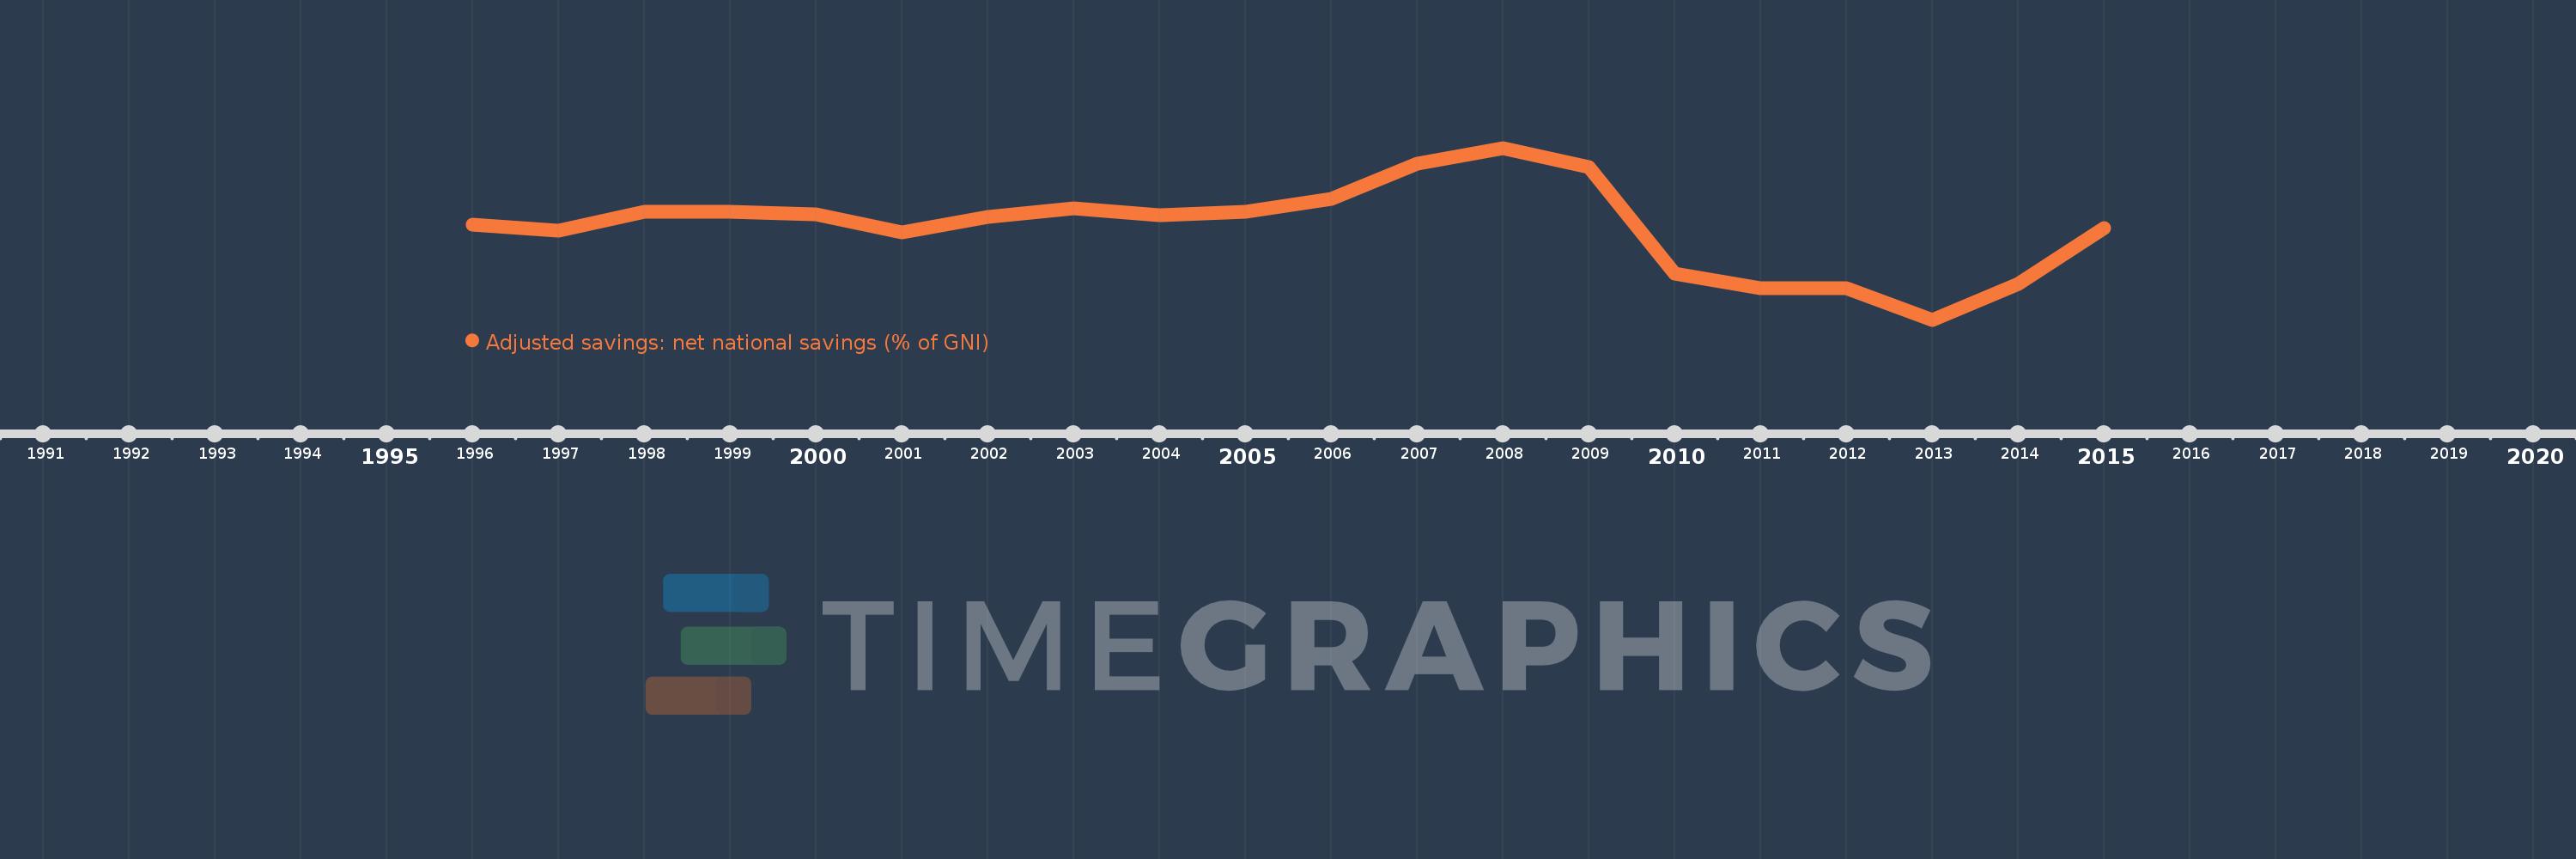
This timeline shows a graph from 1996 to 2015 of Slovenia. No data until 1995. Number of actual observations by date: 20.
Source name:
World Development Indicators
Source organization:
World Bank staff estimates based on sources and methods in World Bank's "The Changing Wealth of Nations: Measuring Sustainable Development in the New Millennium" (2011).
Categories, topics:
Economy & Growth, Environment
Last updated:
apr 23, 2017
Indicators value changes by year
Meaning:
6.491
Minimum:
0.495
jan 1, 2013
Maximum:
11.593
jan 1, 2008
At the date of observation
Value
Absolute change
Change from the previous value
jan 1, 1996
6.654
+6.654
0.0%
jan 1, 1997
6.244
-0.409
-6.15%
jan 1, 1998
7.449
+1.205
19.3%
jan 1, 1999
7.473
+0.024
0.32%
jan 1, 2000
7.292
-0.181
-2.42%
jan 1, 2001
6.138
-1.155
-15.83%
jan 1, 2002
7.133
+0.996
16.22%
jan 1, 2003
7.669
+0.536
7.51%
jan 1, 2004
7.26
-0.409
-5.34%
jan 1, 2005
7.457
+0.197
2.71%
jan 1, 2006
8.318
+0.861
11.55%
jan 1, 2007
10.554
+2.236
26.88%
jan 1, 2008
11.593
+1.04
9.85%
jan 1, 2009
10.38
-1.213
-10.46%
jan 1, 2010
3.482
-6.898
-66.46%
jan 1, 2011
2.511
-0.971
-27.88%
jan 1, 2012
2.514
+0.003
0.11%
jan 1, 2013
0.495
-2.019
-80.3%
jan 1, 2014
2.798
+2.303
465.13%
jan 1, 2015
6.396
+3.597
128.55%
Ranking of countries by current statistics by years
