29
/
en
AIzaSyAYiBZKx7MnpbEhh9jyipgxe19OcubqV5w
April 1, 2024
189841
Mali
MLI
true
2
1
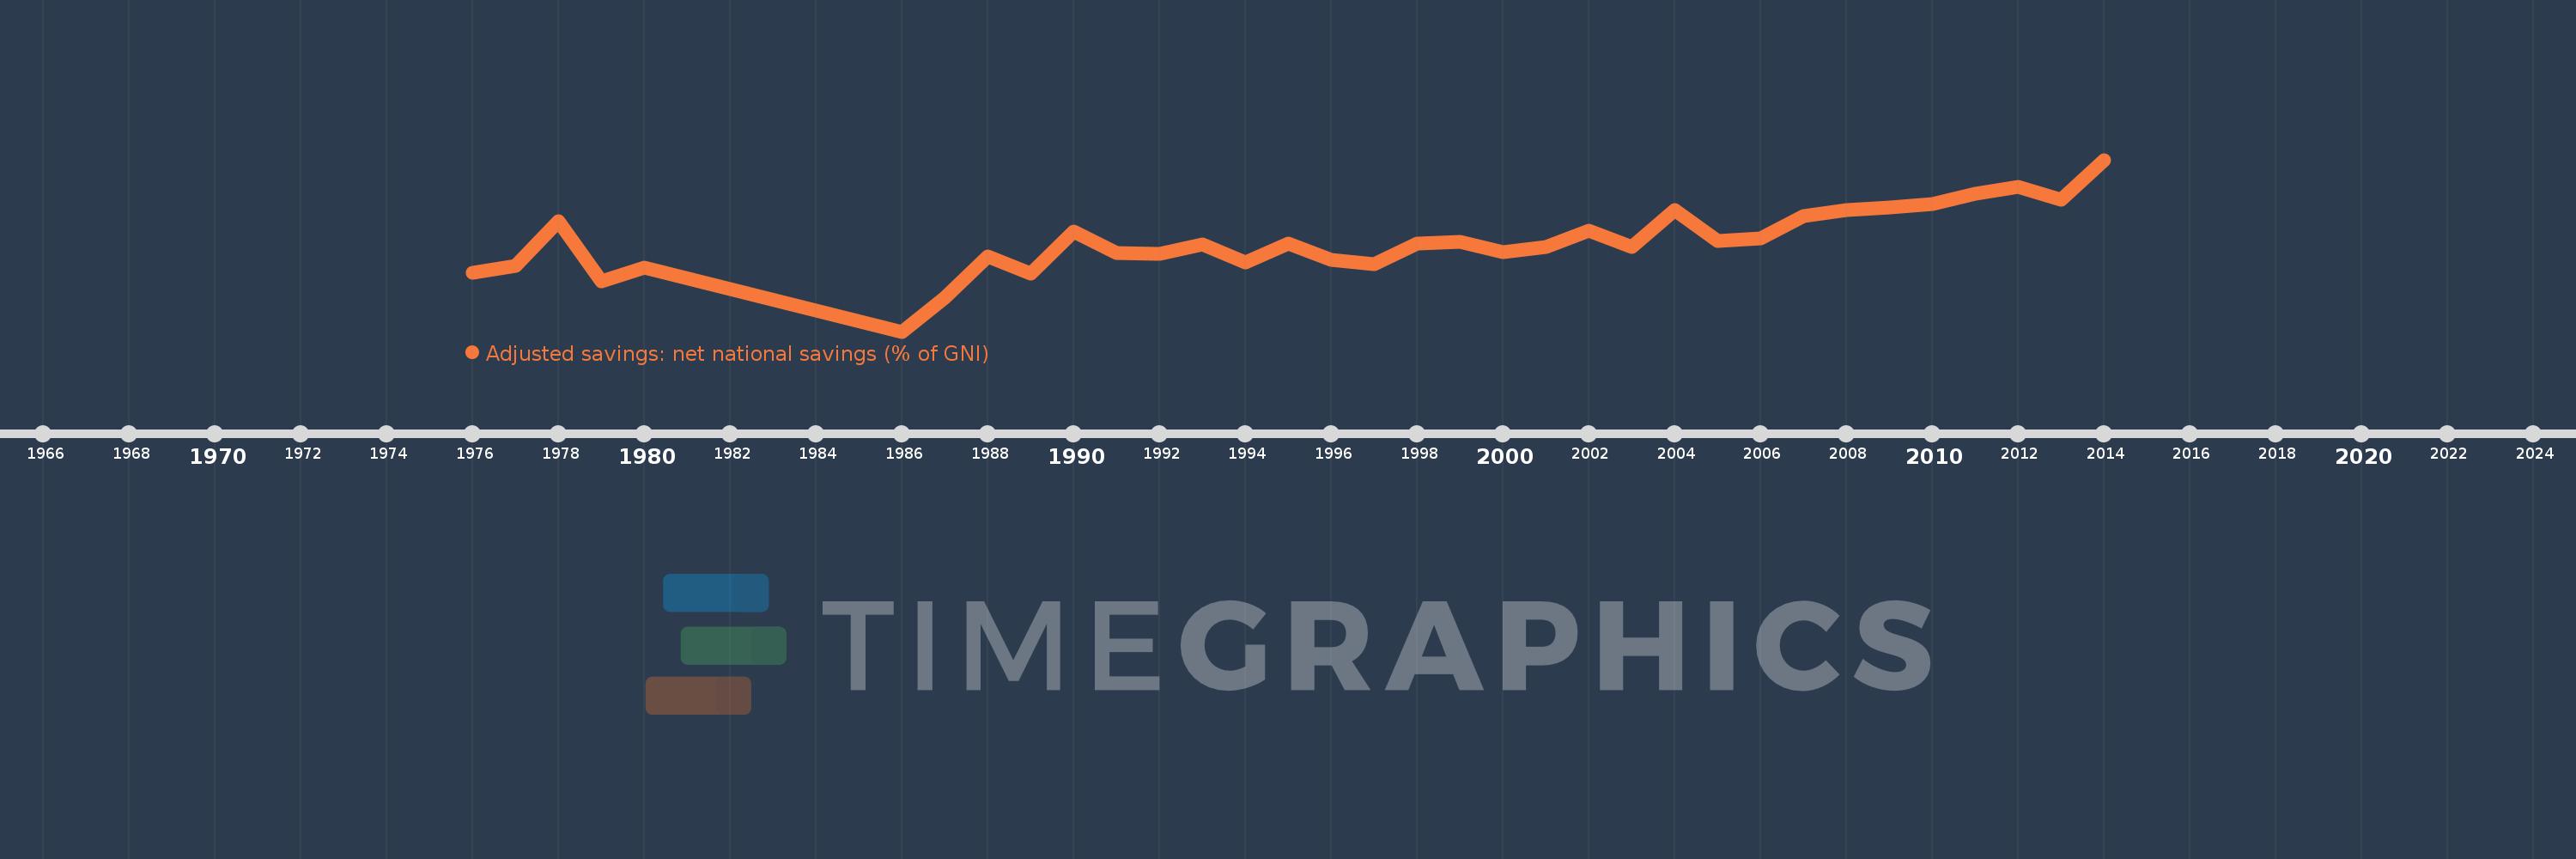
Adjusted savings: net national savings (% of GNI)
2014,2013,2012,2011,2010,2009,2008,2007,2006,2005,2004,2003,2002,2001,2000,1999,1998,1997,1996,1995,1994,1993,1992,1991,1990,1989,1988,1987,1986,1980,1979,1978,1977,1976
This statistics in other country:
AfghanistanAlbaniaAlgeriaAngolaAntigua and BarbudaArab WorldArgentinaArmeniaAustraliaAustriaAzerbaijanBahamas, TheBahrainBangladeshBarbadosBelarusBelgiumBelizeBeninBermudaBhutanBoliviaBosnia and HerzegovinaBotswanaBrazilBrunei DarussalamBulgariaBurkina FasoBurundiCabo VerdeCambodiaCameroonCanadaCaribbean small statesCentral African RepublicCentral Europe and the BalticsChadChileChinaColombiaComorosCongo, Dem. Rep.Congo, Rep.Costa RicaCote d'IvoireCroatiaCyprusCzech RepublicDenmarkDjiboutiDominicaDominican RepublicEarly-demographic dividendEast Asia & PacificEast Asia & Pacific (excluding high income)East Asia & Pacific (IDA & IBRD countries)EcuadorEgypt, Arab Rep.El SalvadorEquatorial GuineaEritreaEstoniaEthiopiaEuro areaEurope & Central AsiaEurope & Central Asia (excluding high income)Europe & Central Asia (IDA & IBRD countries)European UnionFijiFinlandFragile and conflict affected situationsFranceGabonGambia, TheGeorgiaGermanyGhanaGreeceGrenadaGuatemalaGuineaGuinea-BissauGuyanaHaitiHeavily indebted poor countries (HIPC)High incomeHondurasHong Kong SAR, ChinaHungaryIBRD onlyIcelandIDA & IBRD totalIDA blendIDA onlyIDA totalIndiaIndonesiaIran, Islamic Rep.IraqIrelandIsraelItalyJamaicaJapanJordanKazakhstanKenyaKiribatiKorea, Rep.KosovoKuwaitKyrgyz RepublicLao PDRLate-demographic dividendLatin America & Caribbean Latin America & Caribbean (excluding high income)Latin America & the Caribbean (IDA & IBRD countries)LatviaLeast developed countries: UN classificationLebanonLesothoLiberiaLibyaLithuaniaLow & middle incomeLow incomeLower middle incomeLuxembourgMacao SAR, ChinaMacedonia, FYRMadagascarMalawiMalaysiaMaldivesMaliMaltaMauritaniaMauritiusMexicoMiddle East & North AfricaMiddle East & North Africa (excluding high income)Middle East & North Africa (IDA & IBRD countries)Middle incomeMoldovaMongoliaMontenegroMoroccoMozambiqueNamibiaNepalNetherlandsNew ZealandNicaraguaNigerNigeriaNorth AmericaNorwayOECD membersOmanOther small statesPacific island small statesPakistanPanamaPapua New GuineaParaguayPeruPhilippinesPolandPortugalPost-demographic dividendPre-demographic dividendQatarRomaniaRussian FederationRwandaSaudi ArabiaSenegalSerbiaSeychellesSierra LeoneSingaporeSlovak RepublicSloveniaSmall statesSolomon IslandsSouth AfricaSouth AsiaSouth Asia (IDA & IBRD)SpainSri LankaSt. Kitts and NevisSt. LuciaSt. Vincent and the GrenadinesSub-Saharan Africa Sub-Saharan Africa (excluding high income)Sub-Saharan Africa (IDA & IBRD countries)SudanSurinameSwazilandSwedenSwitzerlandSyrian Arab RepublicTajikistanTanzaniaThailandTimor-LesteTogoTongaTrinidad and TobagoTunisiaTurkeyTurkmenistanUgandaUkraineUnited KingdomUnited StatesUpper middle incomeUruguayVanuatuVenezuela, RBVietnamWest Bank and GazaWorldYemen, Rep.ZambiaZimbabwe Timeline:
This timeline shows a graph from 1976 to 2014 of Mali. No data until 1975. Number of actual observations by date: 34.
Source name:
World Development Indicators
Source organization:
World Bank staff estimates based on sources and methods in World Bank's "The Changing Wealth of Nations: Measuring Sustainable Development in the New Millennium" (2011).
Categories, topics:
Economy & Growth, Environment
Last updated:
apr 23, 2017
Indicators value changes by year
Minimum:
-7.541
jan 1, 1986
Maximum:
25.854
jan 1, 2014
At the date of observation
Value
Absolute change
Change from previous value
jan 1, 1976
3.978
+3.978
0.0%
jan 1, 1977
5.151
+1.172
29.47%
jan 1, 1978
13.866
+8.716
169.21%
jan 1, 1979
2.194
-11.673
-84.18%
jan 1, 1980
4.927
+2.733
124.6%
jan 1, 1986
-7.541
-12.468
-253.06%
jan 1, 1987
-0.957
+6.583
-87.3%
jan 1, 1988
7.041
+7.999
-835.4%
jan 1, 1989
3.793
-3.248
-46.13%
jan 1, 1990
11.966
+8.173
215.45%
jan 1, 1991
7.778
-4.188
-35.0%
jan 1, 1992
7.612
-0.166
-2.13%
jan 1, 1993
9.436
+1.824
23.96%
jan 1, 1994
5.947
-3.489
-36.97%
jan 1, 1995
9.553
+3.606
60.63%
jan 1, 1996
6.37
-3.183
-33.32%
jan 1, 1997
5.517
-0.853
-13.4%
jan 1, 1998
9.574
+4.057
73.54%
jan 1, 1999
9.929
+0.355
3.71%
jan 1, 2000
7.835
-2.094
-21.09%
jan 1, 2001
8.914
+1.079
13.77%
jan 1, 2002
12.071
+3.157
35.42%
jan 1, 2003
8.838
-3.234
-26.79%
jan 1, 2004
16.117
+7.28
82.37%
jan 1, 2005
10.03
-6.088
-37.77%
jan 1, 2006
10.652
+0.622
6.2%
jan 1, 2007
14.91
+4.258
39.98%
jan 1, 2008
16.095
+1.185
7.95%
jan 1, 2009
16.506
+0.411
2.56%
jan 1, 2010
17.296
+0.789
4.78%
jan 1, 2011
19.333
+2.037
11.78%
jan 1, 2012
20.651
+1.318
6.82%
jan 1, 2013
18.075
-2.575
-12.47%
jan 1, 2014
25.854
+7.778
43.03%
Ranking of countries by current statistics by years


Comments: