29
/
en
AIzaSyAYiBZKx7MnpbEhh9jyipgxe19OcubqV5w
April 1, 2024
275393
United Kingdom
GBR
true
2
1
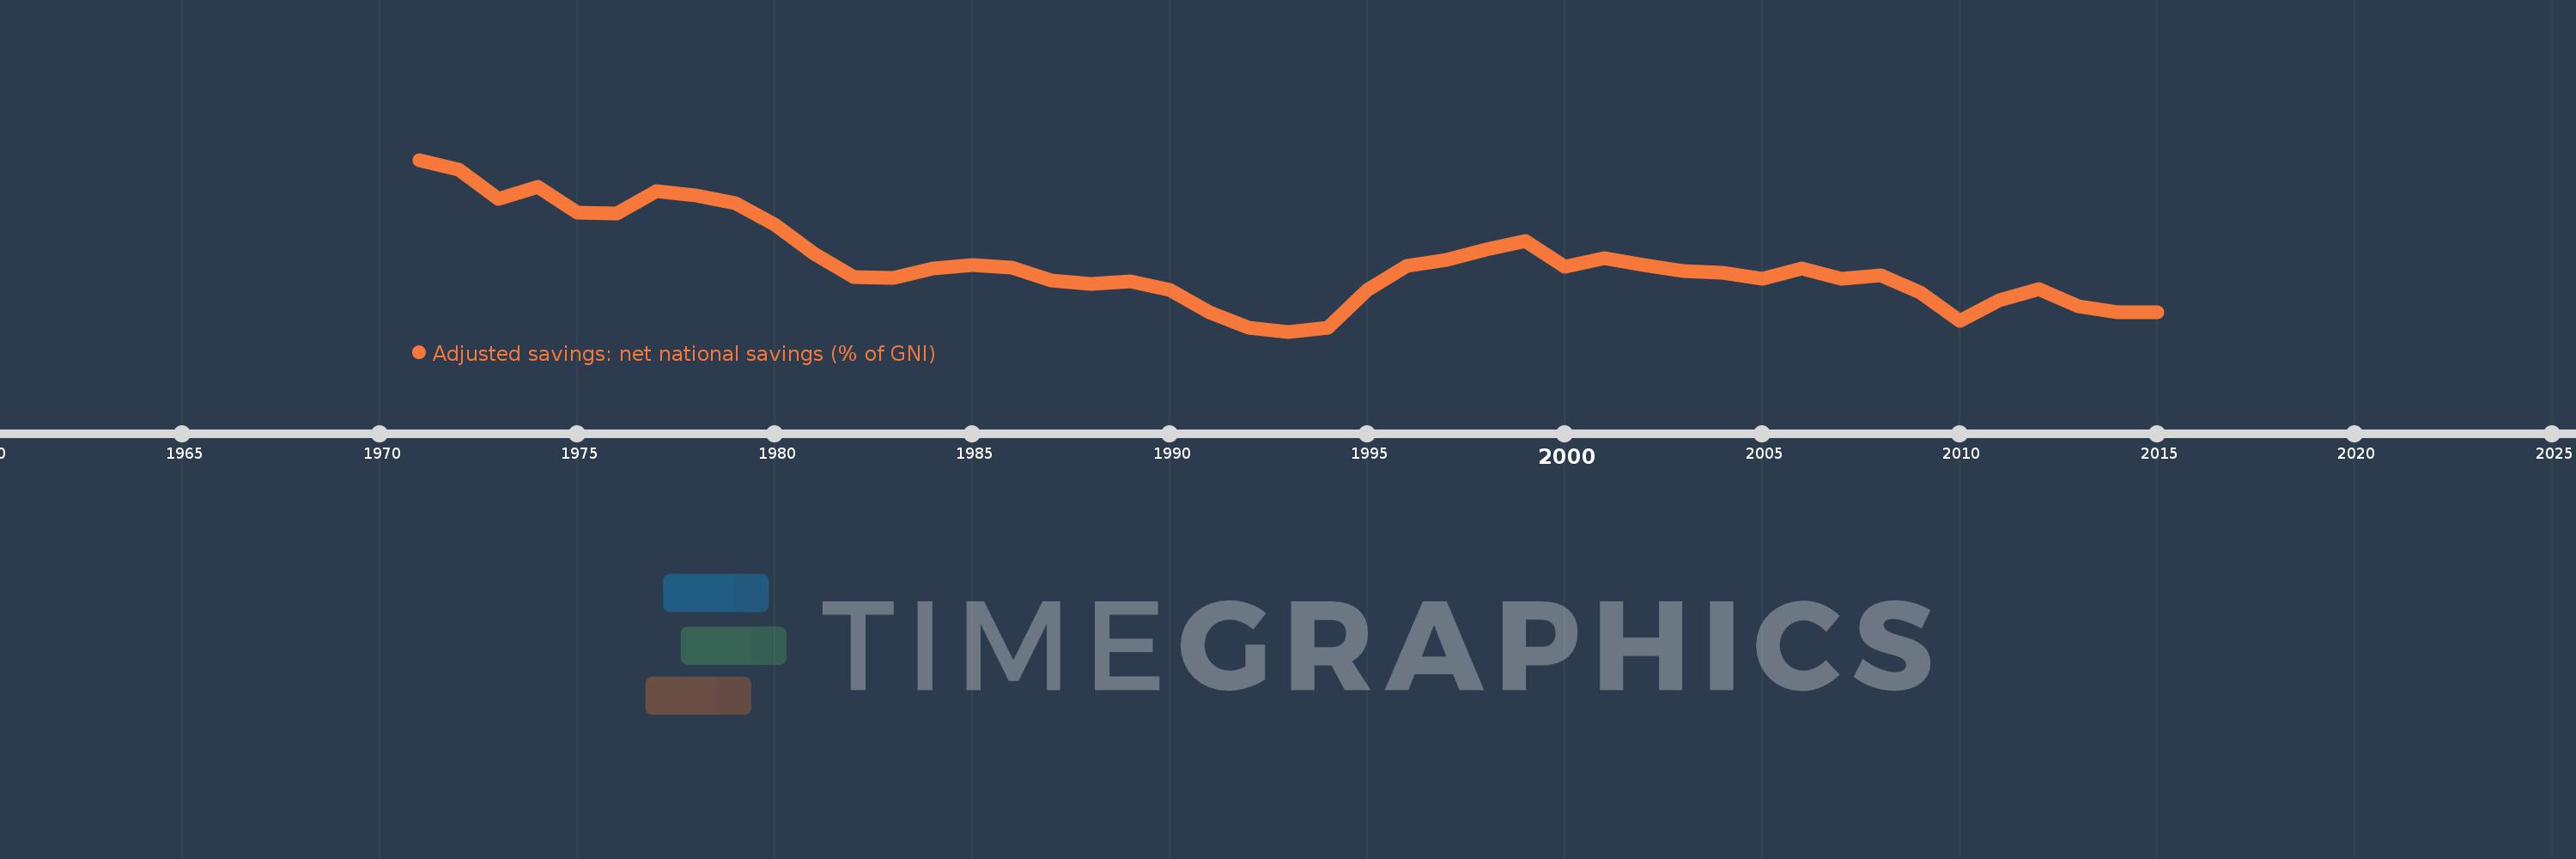
Adjusted savings: net national savings (% of GNI)
2015,2014,2013,2012,2011,2010,2009,2008,2007,2006,2005,2004,2003,2002,2001,2000,1999,1998,1997,1996,1995,1994,1993,1992,1991,1990,1989,1988,1987,1986,1985,1984,1983,1982,1981,1980,1979,1978,1977,1976,1975,1974,1973,1972,1971
This statistics in other country:
AfghanistanAlbaniaAlgeriaAngolaAntigua and BarbudaArab WorldArgentinaArmeniaAustraliaAustriaAzerbaijanBahamas, TheBahrainBangladeshBarbadosBelarusBelgiumBelizeBeninBermudaBhutanBoliviaBosnia and HerzegovinaBotswanaBrazilBrunei DarussalamBulgariaBurkina FasoBurundiCabo VerdeCambodiaCameroonCanadaCaribbean small statesCentral African RepublicCentral Europe and the BalticsChadChileChinaColombiaComorosCongo, Dem. Rep.Congo, Rep.Costa RicaCote d'IvoireCroatiaCyprusCzech RepublicDenmarkDjiboutiDominicaDominican RepublicEarly-demographic dividendEast Asia & PacificEast Asia & Pacific (excluding high income)East Asia & Pacific (IDA & IBRD countries)EcuadorEgypt, Arab Rep.El SalvadorEquatorial GuineaEritreaEstoniaEthiopiaEuro areaEurope & Central AsiaEurope & Central Asia (excluding high income)Europe & Central Asia (IDA & IBRD countries)European UnionFijiFinlandFragile and conflict affected situationsFranceGabonGambia, TheGeorgiaGermanyGhanaGreeceGrenadaGuatemalaGuineaGuinea-BissauGuyanaHaitiHeavily indebted poor countries (HIPC)High incomeHondurasHong Kong SAR, ChinaHungaryIBRD onlyIcelandIDA & IBRD totalIDA blendIDA onlyIDA totalIndiaIndonesiaIran, Islamic Rep.IraqIrelandIsraelItalyJamaicaJapanJordanKazakhstanKenyaKiribatiKorea, Rep.KosovoKuwaitKyrgyz RepublicLao PDRLate-demographic dividendLatin America & Caribbean Latin America & Caribbean (excluding high income)Latin America & the Caribbean (IDA & IBRD countries)LatviaLeast developed countries: UN classificationLebanonLesothoLiberiaLibyaLithuaniaLow & middle incomeLow incomeLower middle incomeLuxembourgMacao SAR, ChinaMacedonia, FYRMadagascarMalawiMalaysiaMaldivesMaliMaltaMauritaniaMauritiusMexicoMiddle East & North AfricaMiddle East & North Africa (excluding high income)Middle East & North Africa (IDA & IBRD countries)Middle incomeMoldovaMongoliaMontenegroMoroccoMozambiqueNamibiaNepalNetherlandsNew ZealandNicaraguaNigerNigeriaNorth AmericaNorwayOECD membersOmanOther small statesPacific island small statesPakistanPanamaPapua New GuineaParaguayPeruPhilippinesPolandPortugalPost-demographic dividendPre-demographic dividendQatarRomaniaRussian FederationRwandaSaudi ArabiaSenegalSerbiaSeychellesSierra LeoneSingaporeSlovak RepublicSloveniaSmall statesSolomon IslandsSouth AfricaSouth AsiaSouth Asia (IDA & IBRD)SpainSri LankaSt. Kitts and NevisSt. LuciaSt. Vincent and the GrenadinesSub-Saharan Africa Sub-Saharan Africa (excluding high income)Sub-Saharan Africa (IDA & IBRD countries)SudanSurinameSwazilandSwedenSwitzerlandSyrian Arab RepublicTajikistanTanzaniaThailandTimor-LesteTogoTongaTrinidad and TobagoTunisiaTurkeyTurkmenistanUgandaUkraineUnited KingdomUnited StatesUpper middle incomeUruguayVanuatuVenezuela, RBVietnamWest Bank and GazaWorldYemen, Rep.ZambiaZimbabwe Timeline:
This timeline shows a graph from 1971 to 2015 of United Kingdom. No data until 1970. Number of actual observations by date: 45.
Source name:
World Development Indicators
Source organization:
World Bank staff estimates based on sources and methods in World Bank's "The Changing Wealth of Nations: Measuring Sustainable Development in the New Millennium" (2011).
Categories, topics:
Economy & Growth, Environment
Last updated:
apr 23, 2017
Indicators value changes by year
Minimum:
-2.599
jan 1, 1993
Maximum:
12.664
jan 1, 1971
At the date of observation
Value
Absolute change
Change from previous value
jan 1, 1971
12.664
+12.664
0.0%
jan 1, 1972
11.793
-0.871
-6.88%
jan 1, 1973
9.182
-2.611
-22.14%
jan 1, 1974
10.286
+1.104
12.02%
jan 1, 1975
8.002
-2.284
-22.2%
jan 1, 1976
7.898
-0.104
-1.29%
jan 1, 1977
9.888
+1.99
25.2%
jan 1, 1978
9.496
-0.393
-3.97%
jan 1, 1979
8.776
-0.72
-7.58%
jan 1, 1980
6.916
-1.859
-21.19%
jan 1, 1981
4.313
-2.604
-37.65%
jan 1, 1982
2.233
-2.08
-48.22%
jan 1, 1983
2.173
-0.06
-2.68%
jan 1, 1984
2.995
+0.821
37.79%
jan 1, 1985
3.29
+0.296
9.88%
jan 1, 1986
3.12
-0.17
-5.17%
jan 1, 1987
1.958
-1.163
-37.26%
jan 1, 1988
1.657
-0.301
-15.36%
jan 1, 1989
1.874
+0.217
13.1%
jan 1, 1990
1.096
-0.778
-41.54%
jan 1, 1991
-0.902
-1.997
-182.29%
jan 1, 1992
-2.282
-1.38
153.11%
jan 1, 1993
-2.599
-0.317
13.88%
jan 1, 1994
-2.267
+0.332
-12.78%
jan 1, 1995
1.107
+3.374
-148.83%
jan 1, 1996
3.249
+2.142
193.55%
jan 1, 1997
3.803
+0.554
17.05%
jan 1, 1998
4.692
+0.889
23.37%
jan 1, 1999
5.485
+0.794
16.91%
jan 1, 2000
3.198
-2.287
-41.69%
jan 1, 2001
3.958
+0.76
23.75%
jan 1, 2002
3.317
-0.641
-16.2%
jan 1, 2003
2.813
-0.503
-15.18%
jan 1, 2004
2.639
-0.175
-6.21%
jan 1, 2005
2.128
-0.511
-19.35%
jan 1, 2006
3.012
+0.884
41.56%
jan 1, 2007
2.116
-0.896
-29.75%
jan 1, 2008
2.379
+0.263
12.41%
jan 1, 2009
0.847
-1.532
-64.38%
jan 1, 2010
-1.648
-2.495
-294.47%
jan 1, 2011
0.162
+1.809
-109.82%
jan 1, 2012
1.183
+1.021
631.04%
jan 1, 2013
-0.36
-1.543
-130.47%
jan 1, 2014
-0.92
-0.56
155.34%
jan 1, 2015
-0.906
+0.014
-1.51%
Ranking of countries by current statistics by years


Comments: