29
/
en
AIzaSyAYiBZKx7MnpbEhh9jyipgxe19OcubqV5w
April 1, 2024
90730
Brazil
BRA
true
2
1
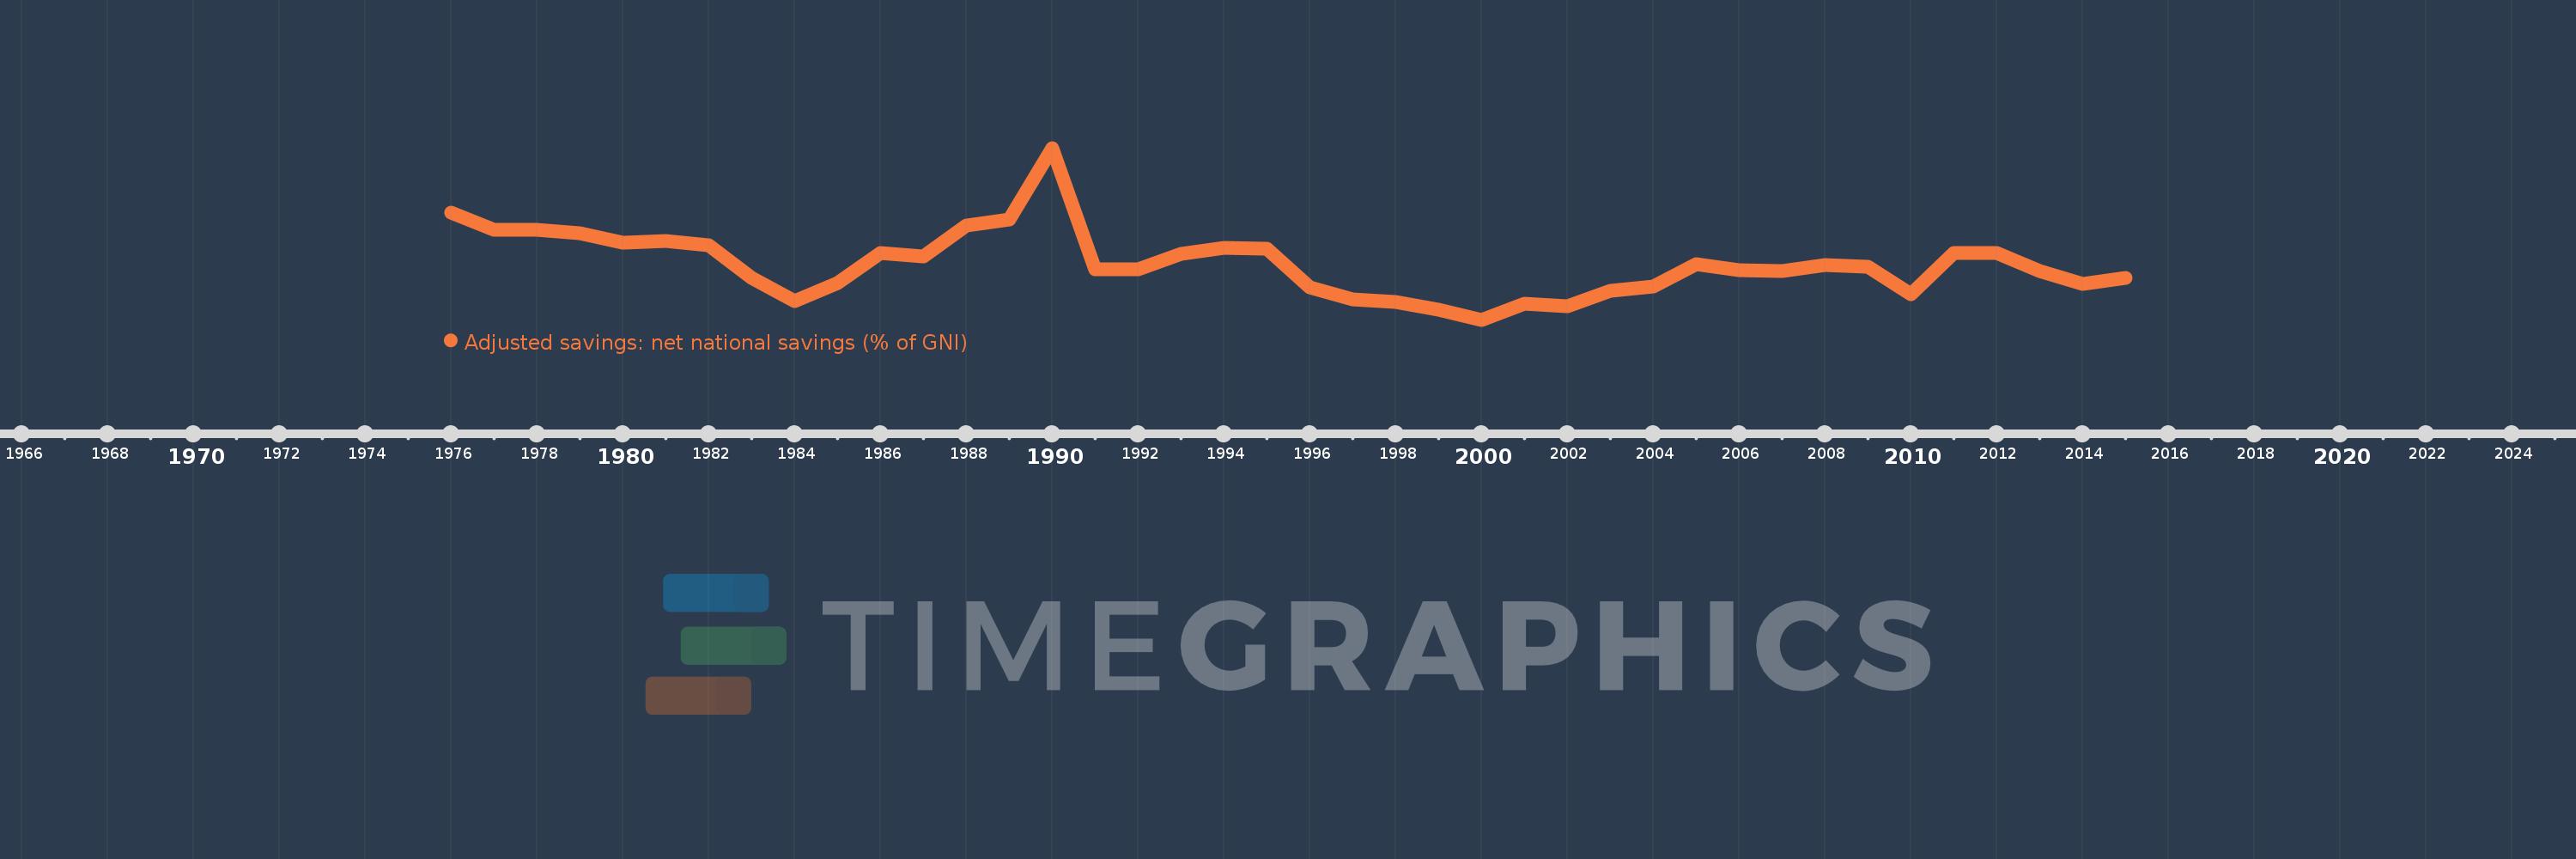
Adjusted savings: net national savings (% of GNI)
2015,2014,2013,2012,2011,2010,2009,2008,2007,2006,2005,2004,2003,2002,2001,2000,1999,1998,1997,1996,1995,1994,1993,1992,1991,1990,1989,1988,1987,1986,1985,1984,1983,1982,1981,1980,1979,1978,1977,1976
This statistics in other country:
AfghanistanAlbaniaAlgeriaAngolaAntigua and BarbudaArab WorldArgentinaArmeniaAustraliaAustriaAzerbaijanBahamas, TheBahrainBangladeshBarbadosBelarusBelgiumBelizeBeninBermudaBhutanBoliviaBosnia and HerzegovinaBotswanaBrazilBrunei DarussalamBulgariaBurkina FasoBurundiCabo VerdeCambodiaCameroonCanadaCaribbean small statesCentral African RepublicCentral Europe and the BalticsChadChileChinaColombiaComorosCongo, Dem. Rep.Congo, Rep.Costa RicaCote d'IvoireCroatiaCyprusCzech RepublicDenmarkDjiboutiDominicaDominican RepublicEarly-demographic dividendEast Asia & PacificEast Asia & Pacific (excluding high income)East Asia & Pacific (IDA & IBRD countries)EcuadorEgypt, Arab Rep.El SalvadorEquatorial GuineaEritreaEstoniaEthiopiaEuro areaEurope & Central AsiaEurope & Central Asia (excluding high income)Europe & Central Asia (IDA & IBRD countries)European UnionFijiFinlandFragile and conflict affected situationsFranceGabonGambia, TheGeorgiaGermanyGhanaGreeceGrenadaGuatemalaGuineaGuinea-BissauGuyanaHaitiHeavily indebted poor countries (HIPC)High incomeHondurasHong Kong SAR, ChinaHungaryIBRD onlyIcelandIDA & IBRD totalIDA blendIDA onlyIDA totalIndiaIndonesiaIran, Islamic Rep.IraqIrelandIsraelItalyJamaicaJapanJordanKazakhstanKenyaKiribatiKorea, Rep.KosovoKuwaitKyrgyz RepublicLao PDRLate-demographic dividendLatin America & Caribbean Latin America & Caribbean (excluding high income)Latin America & the Caribbean (IDA & IBRD countries)LatviaLeast developed countries: UN classificationLebanonLesothoLiberiaLibyaLithuaniaLow & middle incomeLow incomeLower middle incomeLuxembourgMacao SAR, ChinaMacedonia, FYRMadagascarMalawiMalaysiaMaldivesMaliMaltaMauritaniaMauritiusMexicoMiddle East & North AfricaMiddle East & North Africa (excluding high income)Middle East & North Africa (IDA & IBRD countries)Middle incomeMoldovaMongoliaMontenegroMoroccoMozambiqueNamibiaNepalNetherlandsNew ZealandNicaraguaNigerNigeriaNorth AmericaNorwayOECD membersOmanOther small statesPacific island small statesPakistanPanamaPapua New GuineaParaguayPeruPhilippinesPolandPortugalPost-demographic dividendPre-demographic dividendQatarRomaniaRussian FederationRwandaSaudi ArabiaSenegalSerbiaSeychellesSierra LeoneSingaporeSlovak RepublicSloveniaSmall statesSolomon IslandsSouth AfricaSouth AsiaSouth Asia (IDA & IBRD)SpainSri LankaSt. Kitts and NevisSt. LuciaSt. Vincent and the GrenadinesSub-Saharan Africa Sub-Saharan Africa (excluding high income)Sub-Saharan Africa (IDA & IBRD countries)SudanSurinameSwazilandSwedenSwitzerlandSyrian Arab RepublicTajikistanTanzaniaThailandTimor-LesteTogoTongaTrinidad and TobagoTunisiaTurkeyTurkmenistanUgandaUkraineUnited KingdomUnited StatesUpper middle incomeUruguayVanuatuVenezuela, RBVietnamWest Bank and GazaWorldYemen, Rep.ZambiaZimbabwe Timeline:
This timeline shows a graph from 1976 to 2015 of Brazil. No data until 1975. Number of actual observations by date: 40.
Source name:
World Development Indicators
Source organization:
World Bank staff estimates based on sources and methods in World Bank's "The Changing Wealth of Nations: Measuring Sustainable Development in the New Millennium" (2011).
Categories, topics:
Economy & Growth, Environment
Last updated:
apr 23, 2017
Indicators value changes by year
Minimum:
-1.379
jan 1, 2000
At the date of observation
Value
Absolute change
Change from previous value
jan 1, 1976
14.226
+14.226
0.0%
jan 1, 1977
11.816
-2.41
-16.94%
jan 1, 1978
11.749
-0.067
-0.57%
jan 1, 1979
11.231
-0.518
-4.41%
jan 1, 1980
9.891
-1.34
-11.93%
jan 1, 1981
10.105
+0.215
2.17%
jan 1, 1982
9.478
-0.627
-6.21%
jan 1, 1983
4.723
-4.755
-50.17%
jan 1, 1984
1.303
-3.421
-72.42%
jan 1, 1985
3.988
+2.685
206.16%
jan 1, 1986
8.411
+4.423
110.91%
jan 1, 1987
7.891
-0.52
-6.18%
jan 1, 1988
12.416
+4.526
57.35%
jan 1, 1989
13.21
+0.794
6.39%
jan 1, 1990
23.73
+10.52
79.63%
jan 1, 1991
6.045
-17.686
-74.53%
jan 1, 1992
6.047
+0.002
0.04%
jan 1, 1993
8.294
+2.247
37.16%
jan 1, 1994
9.135
+0.84
10.13%
jan 1, 1995
8.961
-0.173
-1.9%
jan 1, 1996
3.324
-5.637
-62.91%
jan 1, 1997
1.627
-1.697
-51.04%
jan 1, 1998
1.216
-0.411
-25.26%
jan 1, 1999
0.089
-1.127
-92.66%
jan 1, 2000
-1.379
-1.469
-1.64K%
jan 1, 2001
0.964
+2.344
-169.9%
jan 1, 2002
0.582
-0.382
-39.65%
jan 1, 2003
2.804
+2.222
381.8%
jan 1, 2004
3.497
+0.694
24.74%
jan 1, 2005
6.697
+3.2
91.49%
jan 1, 2006
5.832
-0.866
-12.92%
jan 1, 2007
5.768
-0.064
-1.1%
jan 1, 2008
6.58
+0.812
14.09%
jan 1, 2009
6.322
-0.258
-3.92%
jan 1, 2010
2.397
-3.925
-62.08%
jan 1, 2011
8.322
+5.925
247.12%
jan 1, 2012
8.407
+0.085
1.02%
jan 1, 2013
5.75
-2.657
-31.6%
jan 1, 2014
3.808
-1.942
-33.77%
jan 1, 2015
4.736
+0.928
24.36%
Ranking of countries by current statistics by years


Comments: