29
/
en
AIzaSyAYiBZKx7MnpbEhh9jyipgxe19OcubqV5w
April 1, 2024
162161
Jamaica
JAM
true
2
1
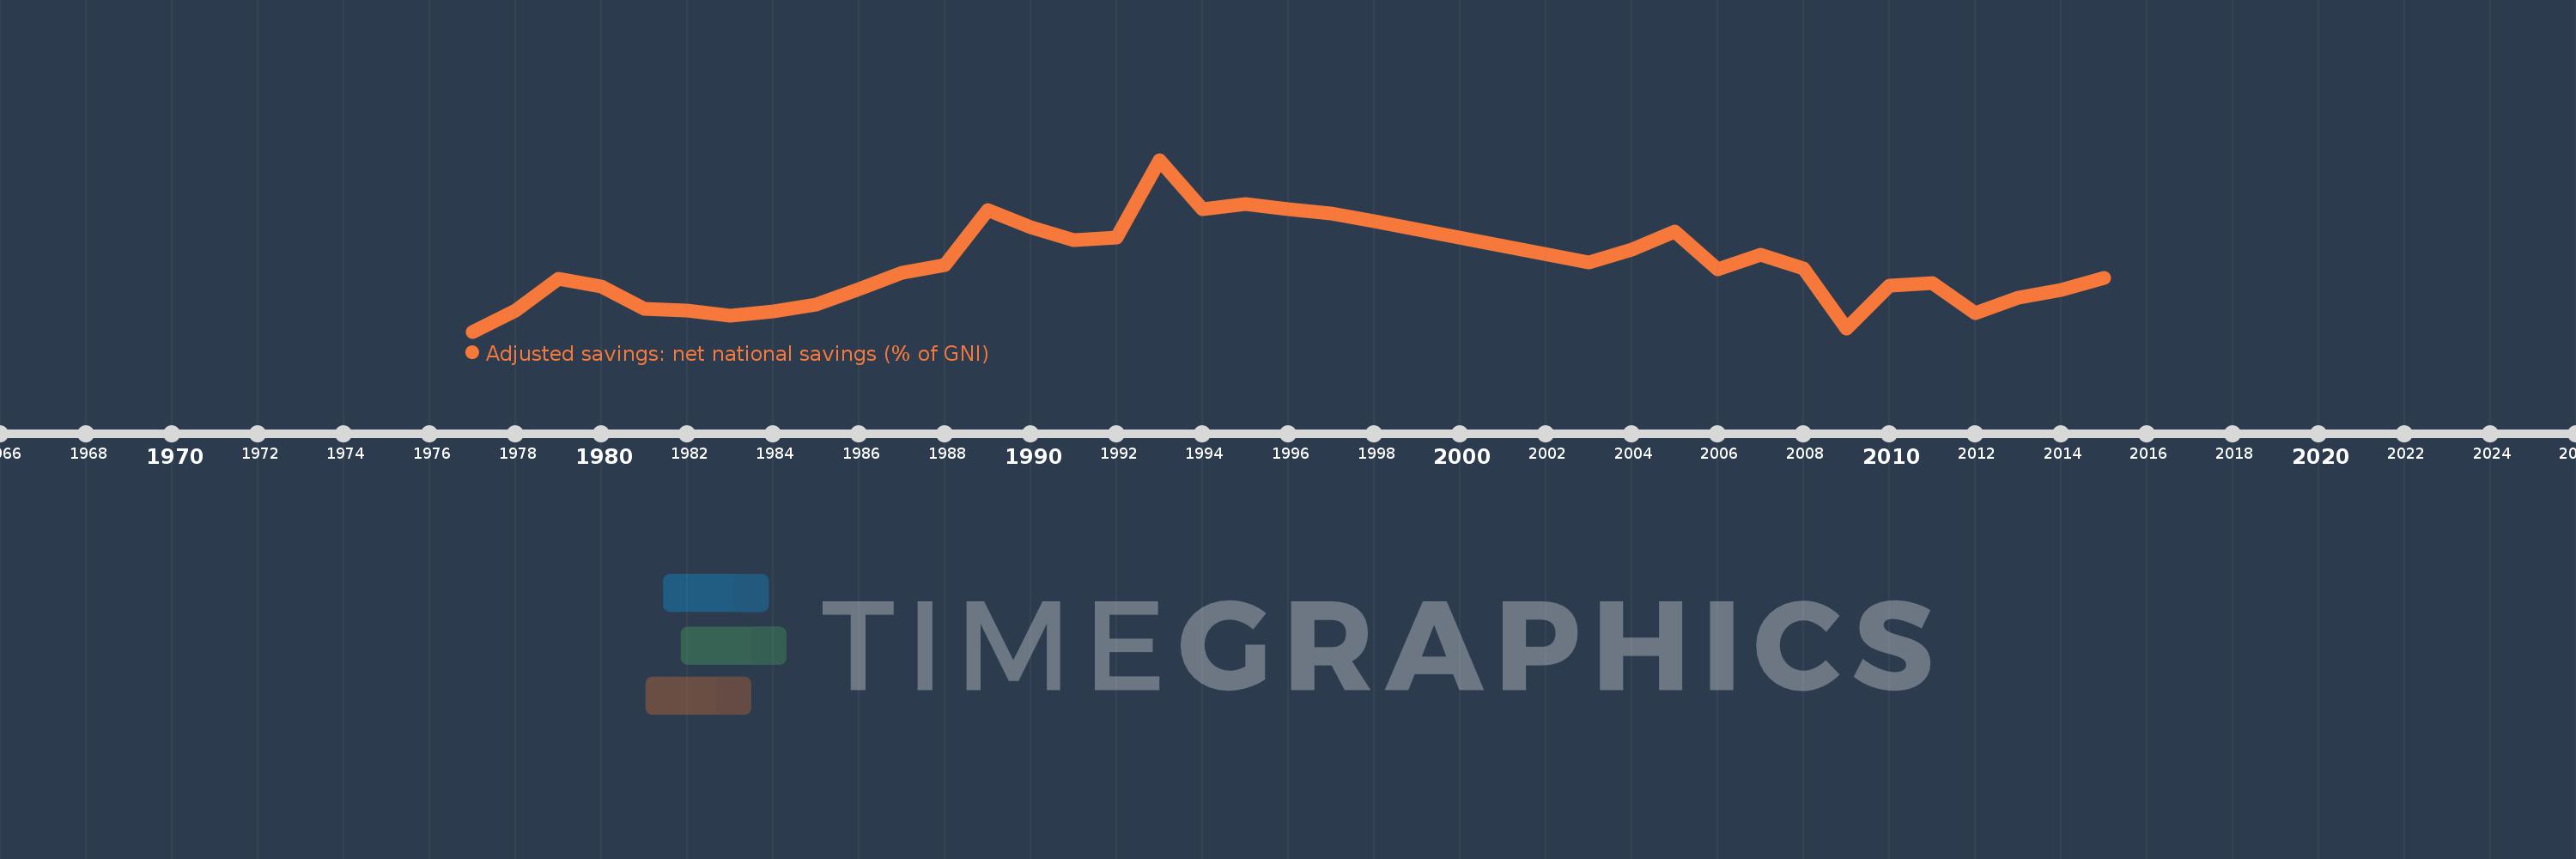
Adjusted savings: net national savings (% of GNI)
2015,2014,2013,2012,2011,2010,2009,2008,2007,2006,2005,2004,2003,1998,1997,1996,1995,1994,1993,1992,1991,1990,1989,1988,1987,1986,1985,1984,1983,1982,1981,1980,1979,1978,1977
This statistics in other country:
AfghanistanAlbaniaAlgeriaAngolaAntigua and BarbudaArab WorldArgentinaArmeniaAustraliaAustriaAzerbaijanBahamas, TheBahrainBangladeshBarbadosBelarusBelgiumBelizeBeninBermudaBhutanBoliviaBosnia and HerzegovinaBotswanaBrazilBrunei DarussalamBulgariaBurkina FasoBurundiCabo VerdeCambodiaCameroonCanadaCaribbean small statesCentral African RepublicCentral Europe and the BalticsChadChileChinaColombiaComorosCongo, Dem. Rep.Congo, Rep.Costa RicaCote d'IvoireCroatiaCyprusCzech RepublicDenmarkDjiboutiDominicaDominican RepublicEarly-demographic dividendEast Asia & PacificEast Asia & Pacific (excluding high income)East Asia & Pacific (IDA & IBRD countries)EcuadorEgypt, Arab Rep.El SalvadorEquatorial GuineaEritreaEstoniaEthiopiaEuro areaEurope & Central AsiaEurope & Central Asia (excluding high income)Europe & Central Asia (IDA & IBRD countries)European UnionFijiFinlandFragile and conflict affected situationsFranceGabonGambia, TheGeorgiaGermanyGhanaGreeceGrenadaGuatemalaGuineaGuinea-BissauGuyanaHaitiHeavily indebted poor countries (HIPC)High incomeHondurasHong Kong SAR, ChinaHungaryIBRD onlyIcelandIDA & IBRD totalIDA blendIDA onlyIDA totalIndiaIndonesiaIran, Islamic Rep.IraqIrelandIsraelItalyJamaicaJapanJordanKazakhstanKenyaKiribatiKorea, Rep.KosovoKuwaitKyrgyz RepublicLao PDRLate-demographic dividendLatin America & Caribbean Latin America & Caribbean (excluding high income)Latin America & the Caribbean (IDA & IBRD countries)LatviaLeast developed countries: UN classificationLebanonLesothoLiberiaLibyaLithuaniaLow & middle incomeLow incomeLower middle incomeLuxembourgMacao SAR, ChinaMacedonia, FYRMadagascarMalawiMalaysiaMaldivesMaliMaltaMauritaniaMauritiusMexicoMiddle East & North AfricaMiddle East & North Africa (excluding high income)Middle East & North Africa (IDA & IBRD countries)Middle incomeMoldovaMongoliaMontenegroMoroccoMozambiqueNamibiaNepalNetherlandsNew ZealandNicaraguaNigerNigeriaNorth AmericaNorwayOECD membersOmanOther small statesPacific island small statesPakistanPanamaPapua New GuineaParaguayPeruPhilippinesPolandPortugalPost-demographic dividendPre-demographic dividendQatarRomaniaRussian FederationRwandaSaudi ArabiaSenegalSerbiaSeychellesSierra LeoneSingaporeSlovak RepublicSloveniaSmall statesSolomon IslandsSouth AfricaSouth AsiaSouth Asia (IDA & IBRD)SpainSri LankaSt. Kitts and NevisSt. LuciaSt. Vincent and the GrenadinesSub-Saharan Africa Sub-Saharan Africa (excluding high income)Sub-Saharan Africa (IDA & IBRD countries)SudanSurinameSwazilandSwedenSwitzerlandSyrian Arab RepublicTajikistanTanzaniaThailandTimor-LesteTogoTongaTrinidad and TobagoTunisiaTurkeyTurkmenistanUgandaUkraineUnited KingdomUnited StatesUpper middle incomeUruguayVanuatuVenezuela, RBVietnamWest Bank and GazaWorldYemen, Rep.ZambiaZimbabwe Timeline:
This timeline shows a graph from 1977 to 2015 of Jamaica. No data until 1976. Number of actual observations by date: 35.
Source name:
World Development Indicators
Source organization:
World Bank staff estimates based on sources and methods in World Bank's "The Changing Wealth of Nations: Measuring Sustainable Development in the New Millennium" (2011).
Categories, topics:
Economy & Growth, Environment
Last updated:
apr 23, 2017
Indicators value changes by year
Minimum:
-2.255
jan 1, 1977
Maximum:
25.708
jan 1, 1993
At the date of observation
Value
Absolute change
Change from previous value
jan 1, 1977
-2.255
-2.255
0.0%
jan 1, 1978
1.121
+3.376
-149.7%
jan 1, 1979
6.393
+5.273
470.45%
jan 1, 1980
5.135
-1.258
-19.68%
jan 1, 1981
1.486
-3.649
-71.06%
jan 1, 1982
1.124
-0.362
-24.35%
jan 1, 1983
0.365
-0.76
-67.56%
jan 1, 1984
0.98
+0.615
168.67%
jan 1, 1985
2.168
+1.188
121.22%
jan 1, 1986
4.629
+2.461
113.53%
jan 1, 1987
7.348
+2.718
58.72%
jan 1, 1988
8.579
+1.231
16.75%
jan 1, 1989
17.547
+8.968
104.55%
jan 1, 1990
14.719
-2.828
-16.12%
jan 1, 1991
12.604
-2.116
-14.37%
jan 1, 1992
13.075
+0.472
3.74%
jan 1, 1993
25.708
+12.633
96.61%
jan 1, 1994
17.665
-8.043
-31.28%
jan 1, 1995
18.443
+0.778
4.4%
jan 1, 1996
17.64
-0.803
-4.35%
jan 1, 1997
16.972
-0.669
-3.79%
jan 1, 1998
15.726
-1.246
-7.34%
jan 1, 2003
9.062
-6.663
-42.37%
jan 1, 2004
11.053
+1.991
21.97%
jan 1, 2005
14.049
+2.995
27.1%
jan 1, 2006
7.928
-6.121
-43.57%
jan 1, 2007
10.229
+2.301
29.02%
jan 1, 2008
8.022
-2.207
-21.57%
jan 1, 2009
-1.711
-9.733
-121.33%
jan 1, 2010
5.271
+6.982
-408.04%
jan 1, 2011
5.672
+0.401
7.61%
jan 1, 2012
0.77
-4.902
-86.43%
jan 1, 2013
3.27
+2.5
324.78%
jan 1, 2014
4.501
+1.231
37.65%
jan 1, 2015
6.469
+1.968
43.71%
Ranking of countries by current statistics by years


Comments: