29
/
en
AIzaSyAYiBZKx7MnpbEhh9jyipgxe19OcubqV5w
April 1, 2024
51314
Middle income
MIC
false
2
1
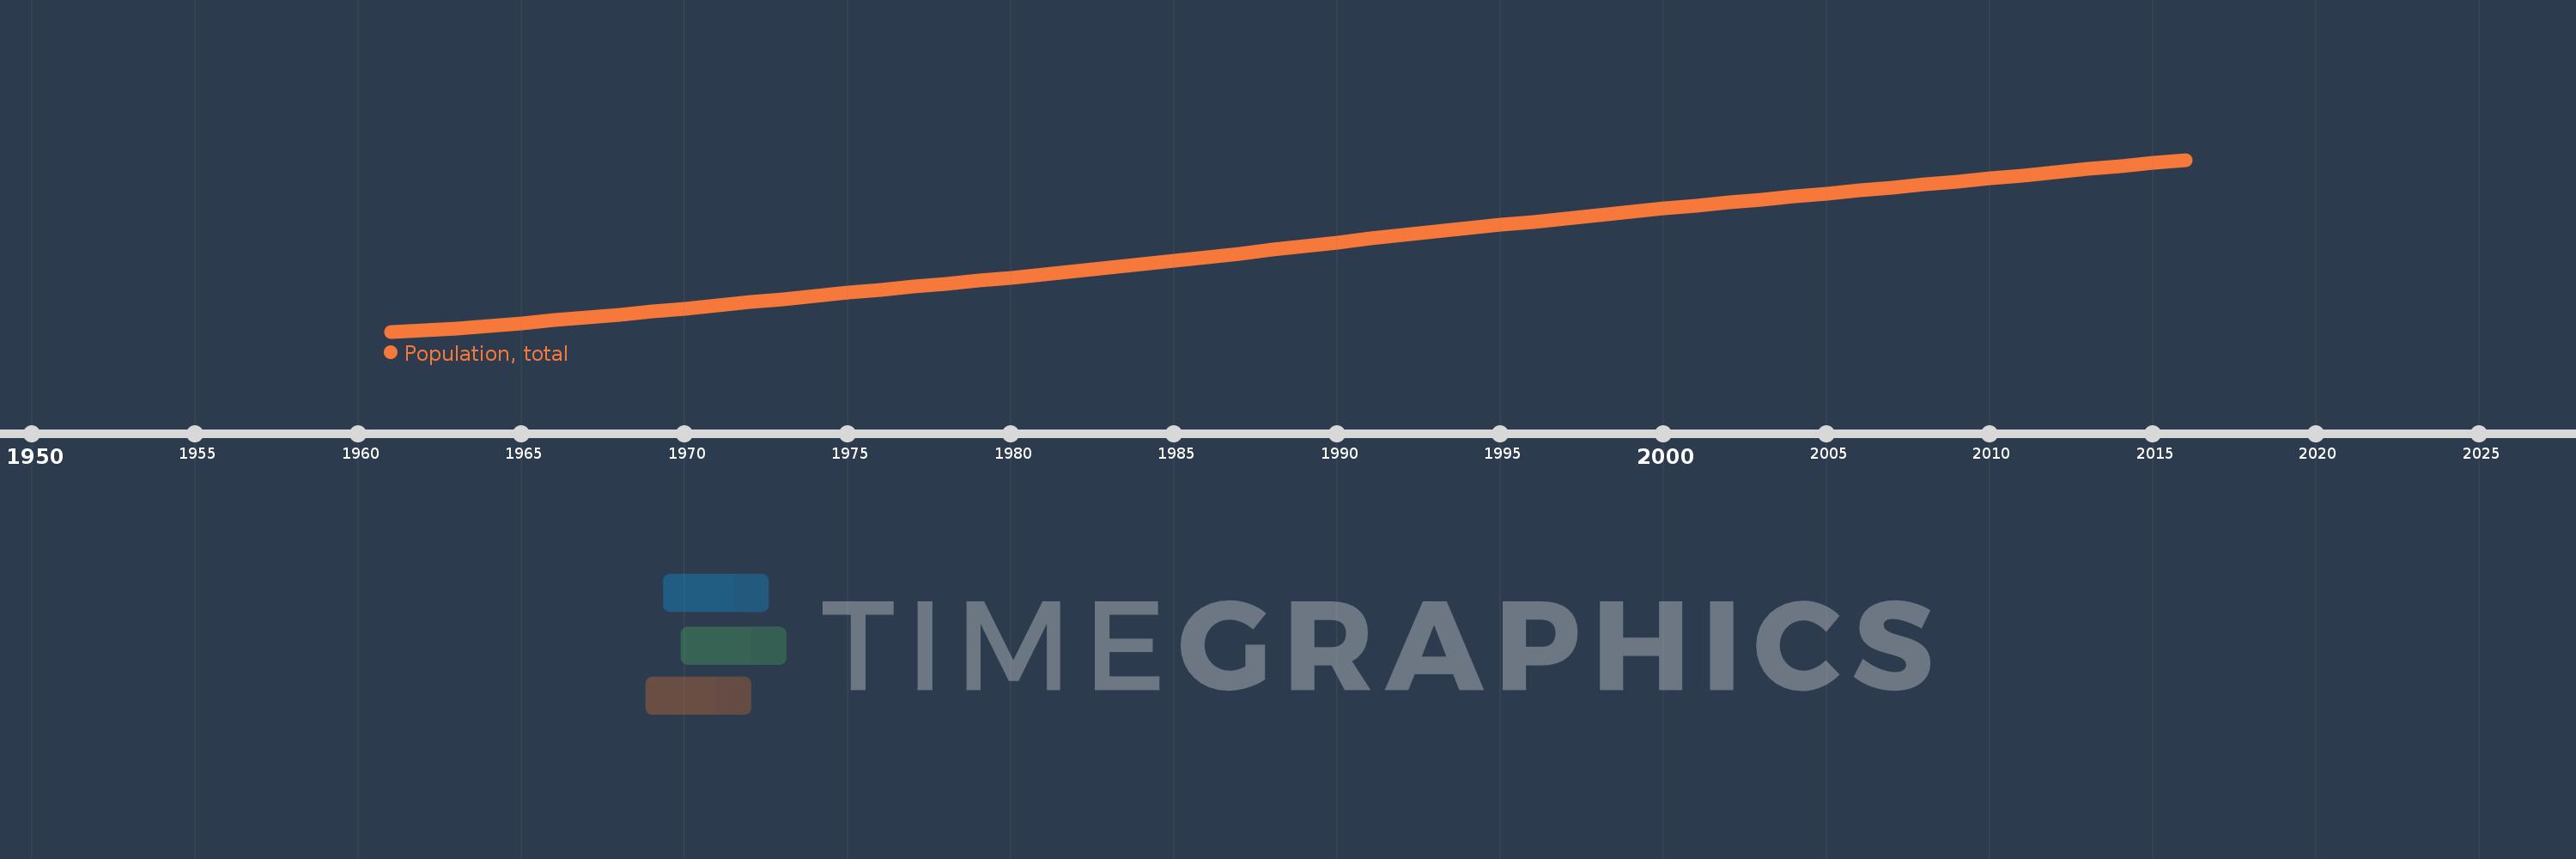
Population, total
2016,2015,2014,2013,2012,2011,2010,2009,2008,2007,2006,2005,2004,2003,2002,2001,2000,1999,1998,1997,1996,1995,1994,1993,1992,1991,1990,1989,1988,1987,1986,1985,1984,1983,1982,1981,1980,1979,1978,1977,1976,1975,1974,1973,1972,1971,1970,1969,1968,1967,1966,1965,1964,1963,1962,1961
This statistics in other country:
AfghanistanAlbaniaAlgeriaAmerican SamoaAndorraAngolaAntigua and BarbudaArab WorldArgentinaArmeniaArubaAustraliaAustriaAzerbaijanBahamas, TheBahrainBangladeshBarbadosBelarusBelgiumBelizeBeninBermudaBhutanBoliviaBosnia and HerzegovinaBotswanaBrazilBritish Virgin IslandsBrunei DarussalamBulgariaBurkina FasoBurundiCabo VerdeCambodiaCameroonCanadaCaribbean small statesCayman IslandsCentral African RepublicCentral Europe and the BalticsChadChannel IslandsChileChinaColombiaComorosCongo, Dem. Rep.Congo, Rep.Costa RicaCote d'IvoireCroatiaCubaCuracaoCyprusCzech RepublicDenmarkDjiboutiDominicaDominican RepublicEarly-demographic dividendEast Asia & PacificEast Asia & Pacific (excluding high income)East Asia & Pacific (IDA & IBRD countries)EcuadorEgypt, Arab Rep.El SalvadorEquatorial GuineaEritreaEstoniaEthiopiaEuro areaEurope & Central AsiaEurope & Central Asia (excluding high income)Europe & Central Asia (IDA & IBRD countries)European UnionFaroe IslandsFijiFinlandFragile and conflict affected situationsFranceFrench PolynesiaGabonGambia, TheGeorgiaGermanyGhanaGibraltarGreeceGreenlandGrenadaGuamGuatemalaGuineaGuinea-BissauGuyanaHaitiHeavily indebted poor countries (HIPC)High incomeHondurasHong Kong SAR, ChinaHungaryIBRD onlyIcelandIDA & IBRD totalIDA blendIDA onlyIDA totalIndiaIndonesiaIran, Islamic Rep.IraqIrelandIsle of ManIsraelItalyJamaicaJapanJordanKazakhstanKenyaKiribatiKorea, Dem. People’s Rep.Korea, Rep.KosovoKuwaitKyrgyz RepublicLao PDRLate-demographic dividendLatin America & Caribbean Latin America & Caribbean (excluding high income)Latin America & the Caribbean (IDA & IBRD countries)LatviaLeast developed countries: UN classificationLebanonLesothoLiberiaLibyaLiechtensteinLithuaniaLow & middle incomeLow incomeLower middle incomeLuxembourgMacao SAR, ChinaMacedonia, FYRMadagascarMalawiMalaysiaMaldivesMaliMaltaMarshall IslandsMauritaniaMauritiusMexicoMicronesia, Fed. Sts.Middle East & North AfricaMiddle East & North Africa (excluding high income)Middle East & North Africa (IDA & IBRD countries)Middle incomeMoldovaMonacoMongoliaMontenegroMoroccoMozambiqueMyanmarNamibiaNauruNepalNetherlandsNew CaledoniaNew ZealandNicaraguaNigerNigeriaNorth AmericaNorthern Mariana IslandsNorwayOECD membersOmanOther small statesPacific island small statesPakistanPalauPanamaPapua New GuineaParaguayPeruPhilippinesPolandPortugalPost-demographic dividendPre-demographic dividendPuerto RicoQatarRomaniaRussian FederationRwandaSamoaSan MarinoSao Tome and PrincipeSaudi ArabiaSenegalSerbiaSeychellesSierra LeoneSingaporeSint Maarten (Dutch part)Slovak RepublicSloveniaSmall statesSolomon IslandsSomaliaSouth AfricaSouth AsiaSouth Asia (IDA & IBRD)South SudanSpainSri LankaSt. Kitts and NevisSt. LuciaSt. Martin (French part)St. Vincent and the GrenadinesSub-Saharan Africa Sub-Saharan Africa (excluding high income)Sub-Saharan Africa (IDA & IBRD countries)SudanSurinameSwazilandSwedenSwitzerlandSyrian Arab RepublicTajikistanTanzaniaThailandTimor-LesteTogoTongaTrinidad and TobagoTunisiaTurkeyTurkmenistanTurks and Caicos IslandsTuvaluUgandaUkraineUnited Arab EmiratesUnited KingdomUnited StatesUpper middle incomeUruguayUzbekistanVanuatuVenezuela, RBVietnamVirgin Islands (U.S.)West Bank and GazaWorldYemen, Rep.ZambiaZimbabwe Timeline:
This timeline shows a graph from 1961 to 2016 of Middle income. No data until 1960. Number of actual observations by date: 56.
Source name:
World Development Indicators
Source organization:
(1) United Nations Population Division. World Population Prospects, (2) Census reports and other statistical publications from national statistical offices, (3) Eurostat: Demographic Statistics, (4) United Nations Statistical Division. Population and Vital Statistics Report (various years), (5) U.S. Census Bureau: International Database, and (6) Secretariat of the Pacific Community: Statistics and Demography Programme.
Categories, topics:
Climate Change, Health
Last updated:
apr 23, 2017
Indicators value changes by year
Minimum:
2.122 bln
jan 1, 1961
Maximum:
5.521 bln
jan 1, 2016
At the date of observation
Value
Absolute change
Change from previous value
jan 1, 1961
2.122 bln
+2.122 bln
0.0%
jan 1, 1962
2.148 bln
+26.289 mln
1.24%
jan 1, 1963
2.187 bln
+39.436 mln
1.84%
jan 1, 1964
2.239 bln
+51.342 mln
2.35%
jan 1, 1965
2.291 bln
+51.798 mln
2.31%
jan 1, 1966
2.344 bln
+53.269 mln
2.33%
jan 1, 1967
2.401 bln
+56.788 mln
2.42%
jan 1, 1968
2.457 bln
+56.587 mln
2.36%
jan 1, 1969
2.515 bln
+58.17 mln
2.37%
jan 1, 1970
2.576 bln
+60.503 mln
2.41%
jan 1, 1971
2.638 bln
+62.046 mln
2.41%
jan 1, 1972
2.701 bln
+63.543 mln
2.41%
jan 1, 1973
2.764 bln
+62.752 mln
2.32%
jan 1, 1974
2.827 bln
+62.572 mln
2.26%
jan 1, 1975
2.889 bln
+62.023 mln
2.19%
jan 1, 1976
2.95 bln
+60.69 mln
2.1%
jan 1, 1977
3.01 bln
+60.052 mln
2.04%
jan 1, 1978
3.069 bln
+59.433 mln
1.97%
jan 1, 1979
3.129 bln
+60.448 mln
1.97%
jan 1, 1980
3.191 bln
+61.872 mln
1.98%
jan 1, 1981
3.254 bln
+62.726 mln
1.97%
jan 1, 1982
3.318 bln
+64.328 mln
1.98%
jan 1, 1983
3.386 bln
+67.615 mln
2.04%
jan 1, 1984
3.455 bln
+68.571 mln
2.03%
jan 1, 1985
3.523 bln
+68.41 mln
1.98%
jan 1, 1986
3.593 bln
+69.806 mln
1.98%
jan 1, 1987
3.665 bln
+71.91 mln
2.0%
jan 1, 1988
3.738 bln
+73.794 mln
2.01%
jan 1, 1989
3.813 bln
+74.153 mln
1.98%
jan 1, 1990
3.886 bln
+73.29 mln
1.92%
jan 1, 1991
3.959 bln
+73.45 mln
1.89%
jan 1, 1992
4.029 bln
+69.788 mln
1.76%
jan 1, 1993
4.097 bln
+67.773 mln
1.68%
jan 1, 1994
4.163 bln
+66.479 mln
1.62%
jan 1, 1995
4.229 bln
+66.014 mln
1.59%
jan 1, 1996
4.295 bln
+65.646 mln
1.55%
jan 1, 1997
4.361 bln
+65.515 mln
1.53%
jan 1, 1998
4.426 bln
+65.546 mln
1.5%
jan 1, 1999
4.491 bln
+64.835 mln
1.46%
jan 1, 2000
4.554 bln
+63.485 mln
1.41%
jan 1, 2001
4.617 bln
+62.468 mln
1.37%
jan 1, 2002
4.678 bln
+60.984 mln
1.32%
jan 1, 2003
4.738 bln
+59.649 mln
1.28%
jan 1, 2004
4.797 bln
+59.472 mln
1.26%
jan 1, 2005
4.856 bln
+59.31 mln
1.24%
jan 1, 2006
4.916 bln
+59.286 mln
1.22%
jan 1, 2007
4.975 bln
+59.008 mln
1.2%
jan 1, 2008
5.033 bln
+58.563 mln
1.18%
jan 1, 2009
5.092 bln
+59.027 mln
1.17%
jan 1, 2010
5.152 bln
+59.801 mln
1.17%
jan 1, 2011
5.212 bln
+60.27 mln
1.17%
jan 1, 2012
5.273 bln
+60.908 mln
1.17%
jan 1, 2013
5.335 bln
+61.372 mln
1.16%
jan 1, 2014
5.397 bln
+61.955 mln
1.16%
jan 1, 2015
5.459 bln
+62.345 mln
1.16%
jan 1, 2016
5.521 bln
+62.296 mln
1.14%
Ranking of countries by current statistics by years


Comments: