29
/
en
AIzaSyAYiBZKx7MnpbEhh9jyipgxe19OcubqV5w
April 1, 2024
276074
United Kingdom
GBR
true
2
1
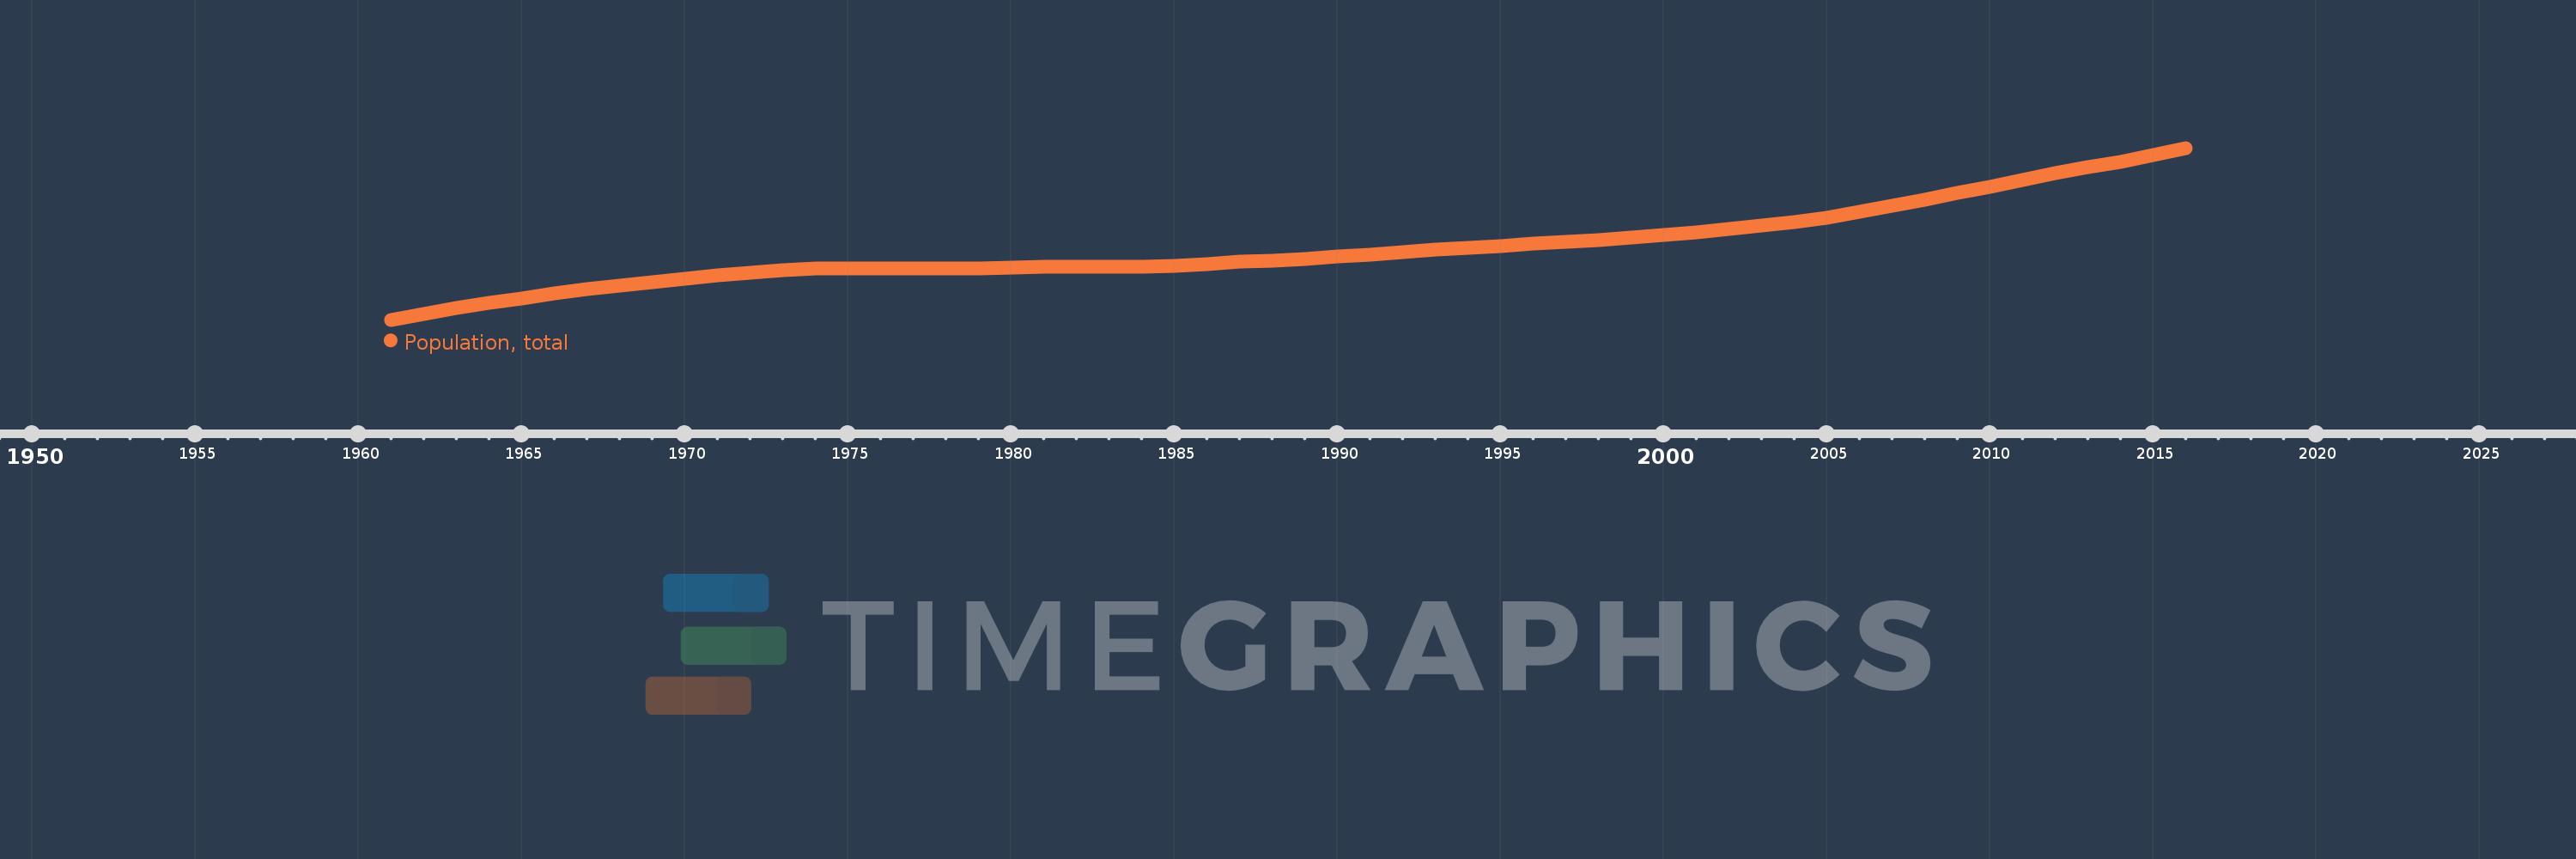
Population, total
2016,2015,2014,2013,2012,2011,2010,2009,2008,2007,2006,2005,2004,2003,2002,2001,2000,1999,1998,1997,1996,1995,1994,1993,1992,1991,1990,1989,1988,1987,1986,1985,1984,1983,1982,1981,1980,1979,1978,1977,1976,1975,1974,1973,1972,1971,1970,1969,1968,1967,1966,1965,1964,1963,1962,1961
This statistics in other country:
AfghanistanAlbaniaAlgeriaAmerican SamoaAndorraAngolaAntigua and BarbudaArab WorldArgentinaArmeniaArubaAustraliaAustriaAzerbaijanBahamas, TheBahrainBangladeshBarbadosBelarusBelgiumBelizeBeninBermudaBhutanBoliviaBosnia and HerzegovinaBotswanaBrazilBritish Virgin IslandsBrunei DarussalamBulgariaBurkina FasoBurundiCabo VerdeCambodiaCameroonCanadaCaribbean small statesCayman IslandsCentral African RepublicCentral Europe and the BalticsChadChannel IslandsChileChinaColombiaComorosCongo, Dem. Rep.Congo, Rep.Costa RicaCote d'IvoireCroatiaCubaCuracaoCyprusCzech RepublicDenmarkDjiboutiDominicaDominican RepublicEarly-demographic dividendEast Asia & PacificEast Asia & Pacific (excluding high income)East Asia & Pacific (IDA & IBRD countries)EcuadorEgypt, Arab Rep.El SalvadorEquatorial GuineaEritreaEstoniaEthiopiaEuro areaEurope & Central AsiaEurope & Central Asia (excluding high income)Europe & Central Asia (IDA & IBRD countries)European UnionFaroe IslandsFijiFinlandFragile and conflict affected situationsFranceFrench PolynesiaGabonGambia, TheGeorgiaGermanyGhanaGibraltarGreeceGreenlandGrenadaGuamGuatemalaGuineaGuinea-BissauGuyanaHaitiHeavily indebted poor countries (HIPC)High incomeHondurasHong Kong SAR, ChinaHungaryIBRD onlyIcelandIDA & IBRD totalIDA blendIDA onlyIDA totalIndiaIndonesiaIran, Islamic Rep.IraqIrelandIsle of ManIsraelItalyJamaicaJapanJordanKazakhstanKenyaKiribatiKorea, Dem. People’s Rep.Korea, Rep.KosovoKuwaitKyrgyz RepublicLao PDRLate-demographic dividendLatin America & Caribbean Latin America & Caribbean (excluding high income)Latin America & the Caribbean (IDA & IBRD countries)LatviaLeast developed countries: UN classificationLebanonLesothoLiberiaLibyaLiechtensteinLithuaniaLow & middle incomeLow incomeLower middle incomeLuxembourgMacao SAR, ChinaMacedonia, FYRMadagascarMalawiMalaysiaMaldivesMaliMaltaMarshall IslandsMauritaniaMauritiusMexicoMicronesia, Fed. Sts.Middle East & North AfricaMiddle East & North Africa (excluding high income)Middle East & North Africa (IDA & IBRD countries)Middle incomeMoldovaMonacoMongoliaMontenegroMoroccoMozambiqueMyanmarNamibiaNauruNepalNetherlandsNew CaledoniaNew ZealandNicaraguaNigerNigeriaNorth AmericaNorthern Mariana IslandsNorwayOECD membersOmanOther small statesPacific island small statesPakistanPalauPanamaPapua New GuineaParaguayPeruPhilippinesPolandPortugalPost-demographic dividendPre-demographic dividendPuerto RicoQatarRomaniaRussian FederationRwandaSamoaSan MarinoSao Tome and PrincipeSaudi ArabiaSenegalSerbiaSeychellesSierra LeoneSingaporeSint Maarten (Dutch part)Slovak RepublicSloveniaSmall statesSolomon IslandsSomaliaSouth AfricaSouth AsiaSouth Asia (IDA & IBRD)South SudanSpainSri LankaSt. Kitts and NevisSt. LuciaSt. Martin (French part)St. Vincent and the GrenadinesSub-Saharan Africa Sub-Saharan Africa (excluding high income)Sub-Saharan Africa (IDA & IBRD countries)SudanSurinameSwazilandSwedenSwitzerlandSyrian Arab RepublicTajikistanTanzaniaThailandTimor-LesteTogoTongaTrinidad and TobagoTunisiaTurkeyTurkmenistanTurks and Caicos IslandsTuvaluUgandaUkraineUnited Arab EmiratesUnited KingdomUnited StatesUpper middle incomeUruguayUzbekistanVanuatuVenezuela, RBVietnamVirgin Islands (U.S.)West Bank and GazaWorldYemen, Rep.ZambiaZimbabwe Timeline:
This timeline shows a graph from 1961 to 2016 of United Kingdom. No data until 1960. Number of actual observations by date: 56.
Source name:
World Development Indicators
Source organization:
(1) United Nations Population Division. World Population Prospects, (2) Census reports and other statistical publications from national statistical offices, (3) Eurostat: Demographic Statistics, (4) United Nations Statistical Division. Population and Vital Statistics Report (various years), (5) U.S. Census Bureau: International Database, and (6) Secretariat of the Pacific Community: Statistics and Demography Programme.
Categories, topics:
Climate Change, Health
Last updated:
apr 23, 2017
Indicators value changes by year
Minimum:
52.4 mln
jan 1, 1961
Maximum:
65.138 mln
jan 1, 2016
At the date of observation
Value
Absolute change
Change from previous value
jan 1, 1961
52.4 mln
+52.4 mln
0.0%
jan 1, 1962
52.8 mln
+400.0K
0.76%
jan 1, 1963
53.25 mln
+450.0K
0.85%
jan 1, 1964
53.65 mln
+400.0K
0.75%
jan 1, 1965
54.0 mln
+350.0K
0.65%
jan 1, 1966
54.348 mln
+348.05K
0.64%
jan 1, 1967
54.648 mln
+300.45K
0.55%
jan 1, 1968
54.944 mln
+295.1K
0.54%
jan 1, 1969
55.212 mln
+268.1K
0.49%
jan 1, 1970
55.442 mln
+230.05K
0.42%
jan 1, 1971
55.663 mln
+221.5K
0.4%
jan 1, 1972
55.896 mln
+232.973K
0.42%
jan 1, 1973
56.086 mln
+189.842K
0.34%
jan 1, 1974
56.195 mln
+108.462K
0.19%
jan 1, 1975
56.23 mln
+35.447K
0.06%
jan 1, 1976
56.226 mln
-4.174K
-0.01%
jan 1, 1977
56.212 mln
-13.832K
-0.02%
jan 1, 1978
56.193 mln
-18.476K
-0.03%
jan 1, 1979
56.197 mln
+3.012K
0.01%
jan 1, 1980
56.247 mln
+50.447K
0.09%
jan 1, 1981
56.314 mln
+67.265K
0.12%
jan 1, 1982
56.334 mln
+19.613K
0.03%
jan 1, 1983
56.314 mln
-20.188K
-0.04%
jan 1, 1984
56.333 mln
+19.207K
0.03%
jan 1, 1985
56.422 mln
+89.224K
0.16%
jan 1, 1986
56.55 mln
+128.196K
0.23%
jan 1, 1987
56.681 mln
+131.128K
0.23%
jan 1, 1988
56.802 mln
+120.654K
0.21%
jan 1, 1989
56.928 mln
+126.277K
0.22%
jan 1, 1990
57.077 mln
+148.384K
0.26%
jan 1, 1991
57.248 mln
+170.875K
0.3%
jan 1, 1992
57.425 mln
+177.311K
0.31%
jan 1, 1993
57.58 mln
+155.505K
0.27%
jan 1, 1994
57.719 mln
+138.212K
0.24%
jan 1, 1995
57.866 mln
+147.131K
0.25%
jan 1, 1996
58.019 mln
+153.285K
0.26%
jan 1, 1997
58.167 mln
+147.92K
0.25%
jan 1, 1998
58.317 mln
+150.004K
0.26%
jan 1, 1999
58.487 mln
+170.187K
0.29%
jan 1, 2000
58.682 mln
+195.325K
0.33%
jan 1, 2001
58.893 mln
+210.048K
0.36%
jan 1, 2002
59.12 mln
+227.159K
0.39%
jan 1, 2003
59.37 mln
+250.806K
0.42%
jan 1, 2004
59.648 mln
+277.098K
0.47%
jan 1, 2005
59.988 mln
+340.328K
0.57%
jan 1, 2006
60.401 mln
+413.301K
0.69%
jan 1, 2007
60.847 mln
+445.614K
0.74%
jan 1, 2008
61.322 mln
+475.643K
0.78%
jan 1, 2009
61.807 mln
+484.532K
0.79%
jan 1, 2010
62.276 mln
+469.275K
0.76%
jan 1, 2011
62.766 mln
+490.095K
0.79%
jan 1, 2012
63.259 mln
+492.553K
0.78%
jan 1, 2013
63.7 mln
+441.382K
0.7%
jan 1, 2014
64.128 mln
+427.926K
0.67%
jan 1, 2015
64.613 mln
+484.934K
0.76%
jan 1, 2016
65.138 mln
+525.072K
0.81%
Ranking of countries by current statistics by years


Comments: