29
/
en
AIzaSyAYiBZKx7MnpbEhh9jyipgxe19OcubqV5w
April 1, 2024
227791
Qatar
QAT
true
2
1
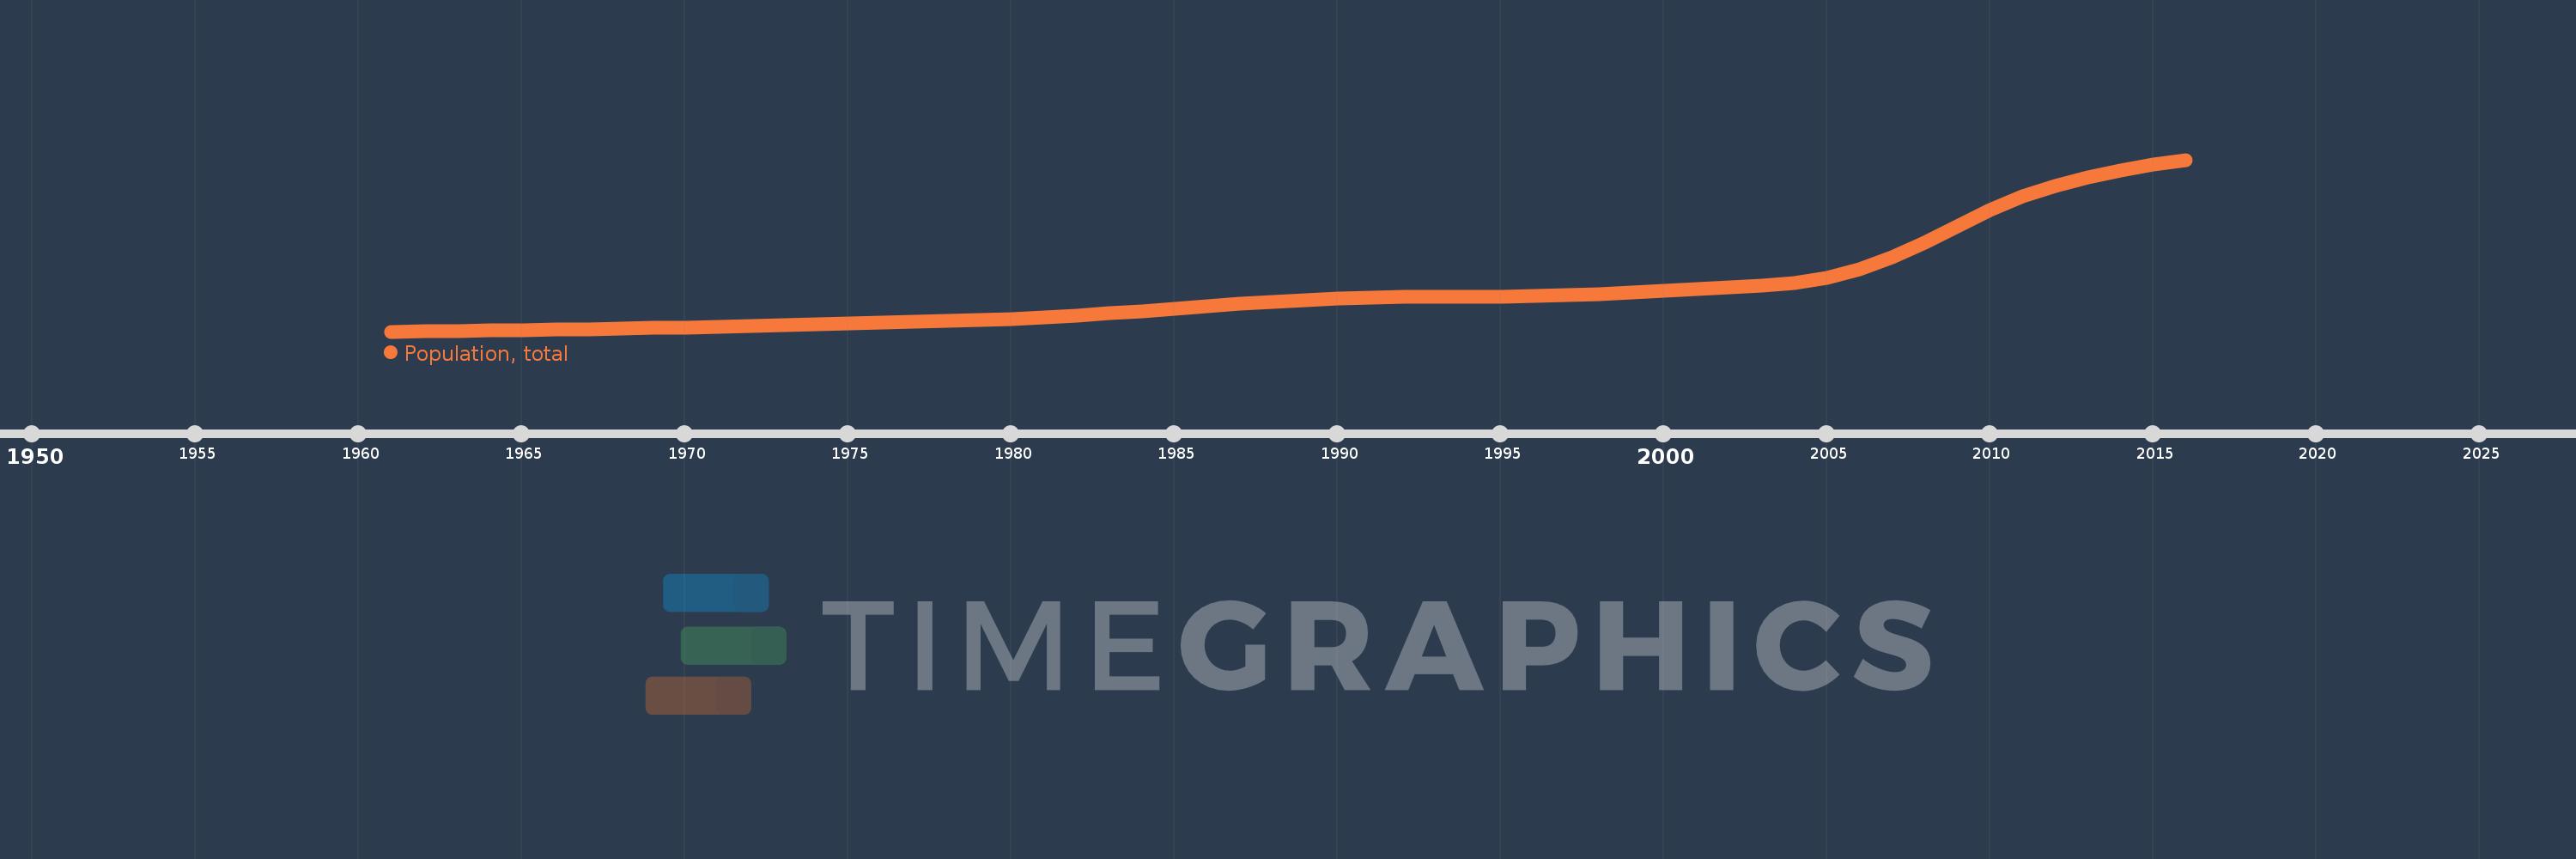
Population, total
2016,2015,2014,2013,2012,2011,2010,2009,2008,2007,2006,2005,2004,2003,2002,2001,2000,1999,1998,1997,1996,1995,1994,1993,1992,1991,1990,1989,1988,1987,1986,1985,1984,1983,1982,1981,1980,1979,1978,1977,1976,1975,1974,1973,1972,1971,1970,1969,1968,1967,1966,1965,1964,1963,1962,1961
This statistics in other country:
AfghanistanAlbaniaAlgeriaAmerican SamoaAndorraAngolaAntigua and BarbudaArab WorldArgentinaArmeniaArubaAustraliaAustriaAzerbaijanBahamas, TheBahrainBangladeshBarbadosBelarusBelgiumBelizeBeninBermudaBhutanBoliviaBosnia and HerzegovinaBotswanaBrazilBritish Virgin IslandsBrunei DarussalamBulgariaBurkina FasoBurundiCabo VerdeCambodiaCameroonCanadaCaribbean small statesCayman IslandsCentral African RepublicCentral Europe and the BalticsChadChannel IslandsChileChinaColombiaComorosCongo, Dem. Rep.Congo, Rep.Costa RicaCote d'IvoireCroatiaCubaCuracaoCyprusCzech RepublicDenmarkDjiboutiDominicaDominican RepublicEarly-demographic dividendEast Asia & PacificEast Asia & Pacific (excluding high income)East Asia & Pacific (IDA & IBRD countries)EcuadorEgypt, Arab Rep.El SalvadorEquatorial GuineaEritreaEstoniaEthiopiaEuro areaEurope & Central AsiaEurope & Central Asia (excluding high income)Europe & Central Asia (IDA & IBRD countries)European UnionFaroe IslandsFijiFinlandFragile and conflict affected situationsFranceFrench PolynesiaGabonGambia, TheGeorgiaGermanyGhanaGibraltarGreeceGreenlandGrenadaGuamGuatemalaGuineaGuinea-BissauGuyanaHaitiHeavily indebted poor countries (HIPC)High incomeHondurasHong Kong SAR, ChinaHungaryIBRD onlyIcelandIDA & IBRD totalIDA blendIDA onlyIDA totalIndiaIndonesiaIran, Islamic Rep.IraqIrelandIsle of ManIsraelItalyJamaicaJapanJordanKazakhstanKenyaKiribatiKorea, Dem. People’s Rep.Korea, Rep.KosovoKuwaitKyrgyz RepublicLao PDRLate-demographic dividendLatin America & Caribbean Latin America & Caribbean (excluding high income)Latin America & the Caribbean (IDA & IBRD countries)LatviaLeast developed countries: UN classificationLebanonLesothoLiberiaLibyaLiechtensteinLithuaniaLow & middle incomeLow incomeLower middle incomeLuxembourgMacao SAR, ChinaMacedonia, FYRMadagascarMalawiMalaysiaMaldivesMaliMaltaMarshall IslandsMauritaniaMauritiusMexicoMicronesia, Fed. Sts.Middle East & North AfricaMiddle East & North Africa (excluding high income)Middle East & North Africa (IDA & IBRD countries)Middle incomeMoldovaMonacoMongoliaMontenegroMoroccoMozambiqueMyanmarNamibiaNauruNepalNetherlandsNew CaledoniaNew ZealandNicaraguaNigerNigeriaNorth AmericaNorthern Mariana IslandsNorwayOECD membersOmanOther small statesPacific island small statesPakistanPalauPanamaPapua New GuineaParaguayPeruPhilippinesPolandPortugalPost-demographic dividendPre-demographic dividendPuerto RicoQatarRomaniaRussian FederationRwandaSamoaSan MarinoSao Tome and PrincipeSaudi ArabiaSenegalSerbiaSeychellesSierra LeoneSingaporeSint Maarten (Dutch part)Slovak RepublicSloveniaSmall statesSolomon IslandsSomaliaSouth AfricaSouth AsiaSouth Asia (IDA & IBRD)South SudanSpainSri LankaSt. Kitts and NevisSt. LuciaSt. Martin (French part)St. Vincent and the GrenadinesSub-Saharan Africa Sub-Saharan Africa (excluding high income)Sub-Saharan Africa (IDA & IBRD countries)SudanSurinameSwazilandSwedenSwitzerlandSyrian Arab RepublicTajikistanTanzaniaThailandTimor-LesteTogoTongaTrinidad and TobagoTunisiaTurkeyTurkmenistanTurks and Caicos IslandsTuvaluUgandaUkraineUnited Arab EmiratesUnited KingdomUnited StatesUpper middle incomeUruguayUzbekistanVanuatuVenezuela, RBVietnamVirgin Islands (U.S.)West Bank and GazaWorldYemen, Rep.ZambiaZimbabwe Timeline:
This timeline shows a graph from 1961 to 2016 of Qatar. No data until 1960. Number of actual observations by date: 56.
Source name:
World Development Indicators
Source organization:
(1) United Nations Population Division. World Population Prospects, (2) Census reports and other statistical publications from national statistical offices, (3) Eurostat: Demographic Statistics, (4) United Nations Statistical Division. Population and Vital Statistics Report (various years), (5) U.S. Census Bureau: International Database, and (6) Secretariat of the Pacific Community: Statistics and Demography Programme.
Categories, topics:
Climate Change, Health
Last updated:
apr 23, 2017
Indicators value changes by year
Minimum:
47.309K
jan 1, 1961
Maximum:
2.235 mln
jan 1, 2016
At the date of observation
Value
Absolute change
Change from previous value
jan 1, 1961
47.309K
+47.309K
0.0%
jan 1, 1962
51.355K
+4.046K
8.55%
jan 1, 1963
56.187K
+4.832K
9.41%
jan 1, 1964
61.647K
+5.46K
9.72%
jan 1, 1965
67.487K
+5.84K
9.47%
jan 1, 1966
73.543K
+6.056K
8.97%
jan 1, 1967
79.735K
+6.192K
8.42%
jan 1, 1968
86.161K
+6.426K
8.06%
jan 1, 1969
93.043K
+6.882K
7.99%
jan 1, 1970
100.697K
+7.654K
8.23%
jan 1, 1971
109.329K
+8.632K
8.57%
jan 1, 1972
119.246K
+9.917K
9.07%
jan 1, 1973
130.377K
+11.131K
9.33%
jan 1, 1974
142.111K
+11.734K
9.0%
jan 1, 1975
153.593K
+11.482K
8.08%
jan 1, 1976
164.333K
+10.74K
6.99%
jan 1, 1977
173.759K
+9.426K
5.74%
jan 1, 1978
182.37K
+8.611K
4.96%
jan 1, 1979
192.018K
+9.648K
5.29%
jan 1, 1980
205.244K
+13.226K
6.89%
jan 1, 1981
223.715K
+18.471K
9.0%
jan 1, 1982
248.053K
+24.338K
10.88%
jan 1, 1983
277.242K
+29.189K
11.77%
jan 1, 1984
309.276K
+32.034K
11.55%
jan 1, 1985
341.286K
+32.01K
10.35%
jan 1, 1986
371.071K
+29.785K
8.73%
jan 1, 1987
398.326K
+27.255K
7.34%
jan 1, 1988
423.327K
+25.001K
6.28%
jan 1, 1989
445.203K
+21.876K
5.17%
jan 1, 1990
463.062K
+17.859K
4.01%
jan 1, 1991
476.478K
+13.416K
2.9%
jan 1, 1992
485.114K
+8.636K
1.81%
jan 1, 1993
489.668K
+4.554K
0.94%
jan 1, 1994
492.12K
+2.452K
0.5%
jan 1, 1995
495.179K
+3.059K
0.62%
jan 1, 1996
501.019K
+5.84K
1.18%
jan 1, 1997
511.864K
+10.845K
2.16%
jan 1, 1998
528.213K
+16.349K
3.19%
jan 1, 1999
548.618K
+20.405K
3.86%
jan 1, 2000
570.643K
+22.025K
4.01%
jan 1, 2001
593.453K
+22.81K
4.0%
jan 1, 2002
613.72K
+20.267K
3.42%
jan 1, 2003
634.388K
+20.668K
3.37%
jan 1, 2004
668.165K
+33.777K
5.32%
jan 1, 2005
732.096K
+63.931K
9.57%
jan 1, 2006
836.924K
+104.828K
14.32%
jan 1, 2007
988.448K
+151.524K
18.1%
jan 1, 2008
1.179 mln
+190.507K
19.27%
jan 1, 2009
1.389 mln
+210.007K
17.81%
jan 1, 2010
1.591 mln
+202.189K
14.56%
jan 1, 2011
1.766 mln
+174.362K
10.96%
jan 1, 2012
1.905 mln
+139.924K
7.93%
jan 1, 2013
2.016 mln
+110.187K
5.78%
jan 1, 2014
2.101 mln
+85.664K
4.25%
jan 1, 2015
2.172 mln
+70.777K
3.37%
jan 1, 2016
2.235 mln
+63.29K
2.91%
Ranking of countries by current statistics by years


Comments: