29
/
en
AIzaSyAYiBZKx7MnpbEhh9jyipgxe19OcubqV5w
April 1, 2024
244034
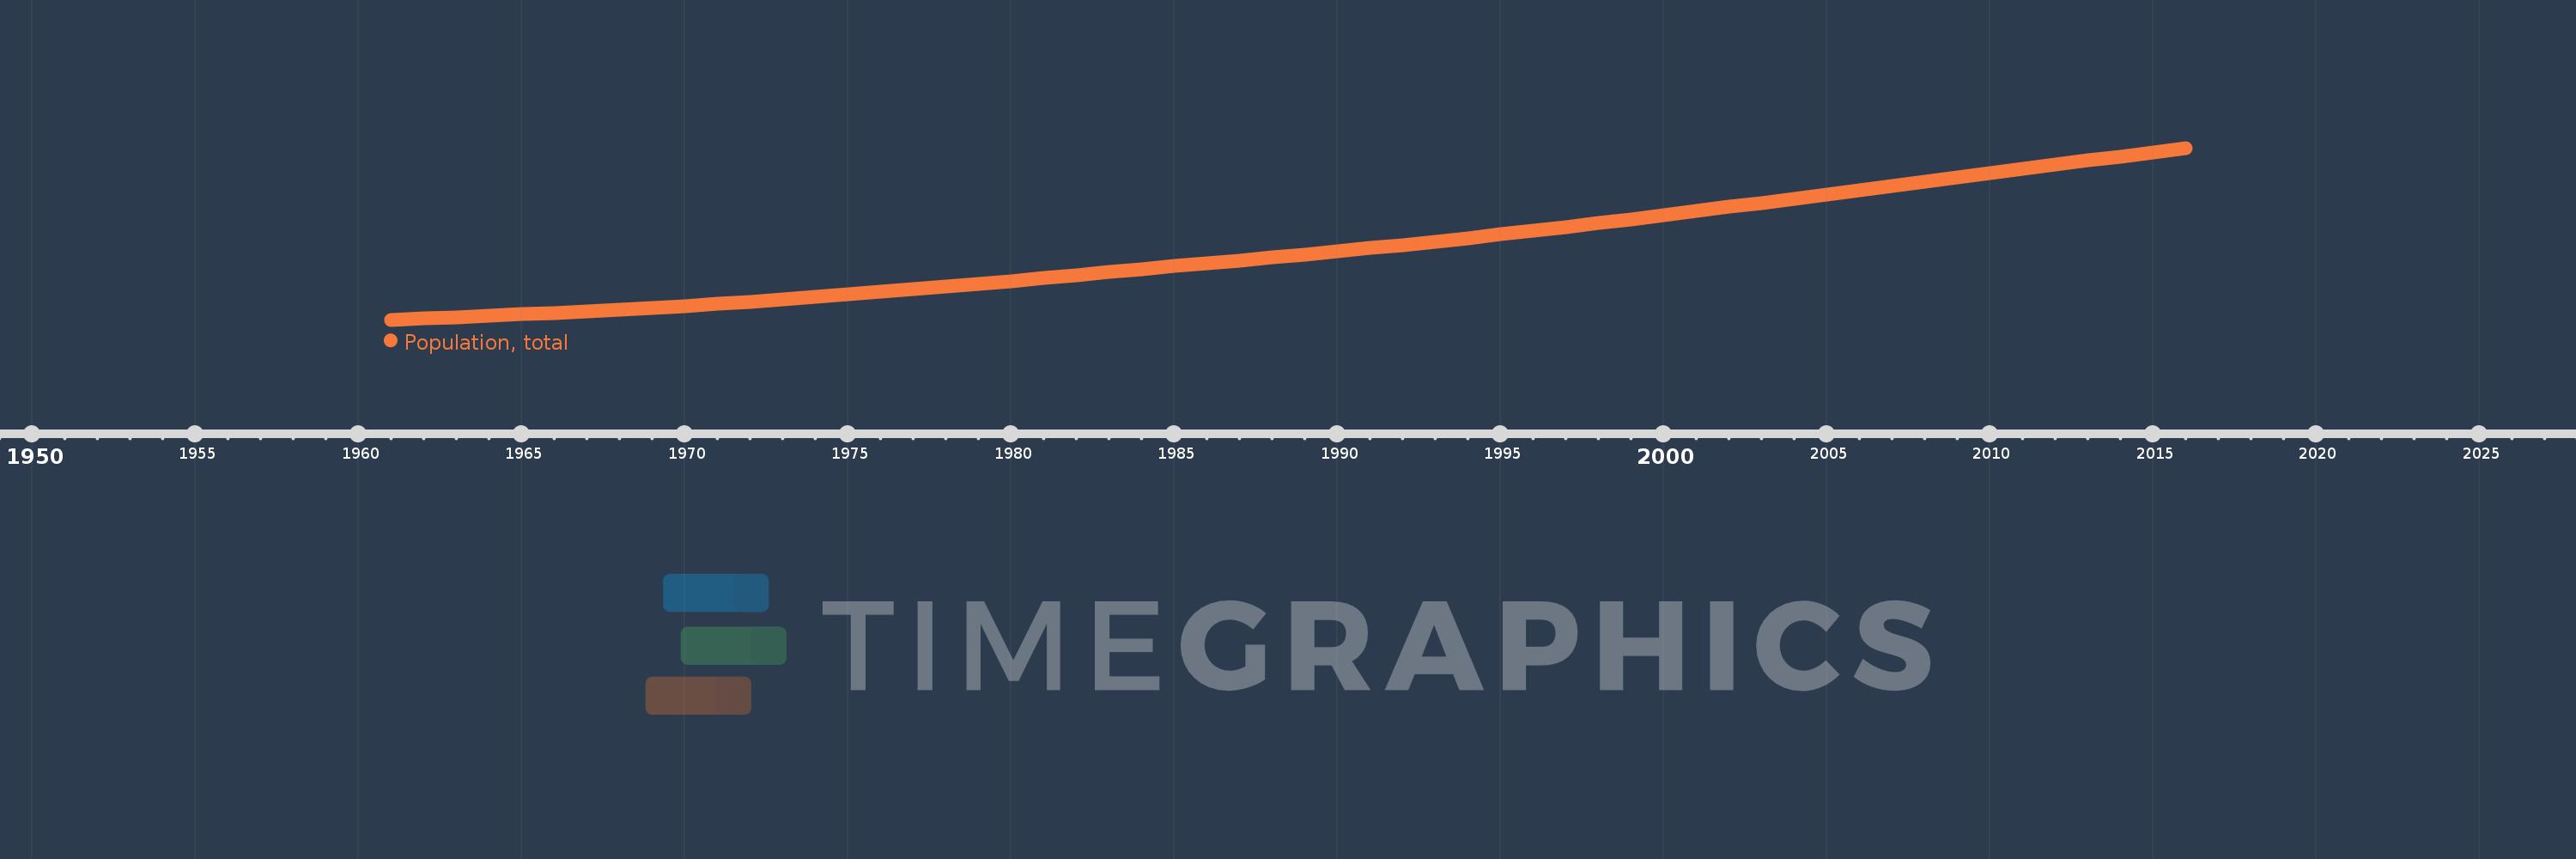
Solomon Islands
SLB
true
2
1
Population, total
2016,2015,2014,2013,2012,2011,2010,2009,2008,2007,2006,2005,2004,2003,2002,2001,2000,1999,1998,1997,1996,1995,1994,1993,1992,1991,1990,1989,1988,1987,1986,1985,1984,1983,1982,1981,1980,1979,1978,1977,1976,1975,1974,1973,1972,1971,1970,1969,1968,1967,1966,1965,1964,1963,1962,1961
This statistics in other country:
AfghanistanAlbaniaAlgeriaAmerican SamoaAndorraAngolaAntigua and BarbudaArab WorldArgentinaArmeniaArubaAustraliaAustriaAzerbaijanBahamas, TheBahrainBangladeshBarbadosBelarusBelgiumBelizeBeninBermudaBhutanBoliviaBosnia and HerzegovinaBotswanaBrazilBritish Virgin IslandsBrunei DarussalamBulgariaBurkina FasoBurundiCabo VerdeCambodiaCameroonCanadaCaribbean small statesCayman IslandsCentral African RepublicCentral Europe and the BalticsChadChannel IslandsChileChinaColombiaComorosCongo, Dem. Rep.Congo, Rep.Costa RicaCote d'IvoireCroatiaCubaCuracaoCyprusCzech RepublicDenmarkDjiboutiDominicaDominican RepublicEarly-demographic dividendEast Asia & PacificEast Asia & Pacific (excluding high income)East Asia & Pacific (IDA & IBRD countries)EcuadorEgypt, Arab Rep.El SalvadorEquatorial GuineaEritreaEstoniaEthiopiaEuro areaEurope & Central AsiaEurope & Central Asia (excluding high income)Europe & Central Asia (IDA & IBRD countries)European UnionFaroe IslandsFijiFinlandFragile and conflict affected situationsFranceFrench PolynesiaGabonGambia, TheGeorgiaGermanyGhanaGibraltarGreeceGreenlandGrenadaGuamGuatemalaGuineaGuinea-BissauGuyanaHaitiHeavily indebted poor countries (HIPC)High incomeHondurasHong Kong SAR, ChinaHungaryIBRD onlyIcelandIDA & IBRD totalIDA blendIDA onlyIDA totalIndiaIndonesiaIran, Islamic Rep.IraqIrelandIsle of ManIsraelItalyJamaicaJapanJordanKazakhstanKenyaKiribatiKorea, Dem. People’s Rep.Korea, Rep.KosovoKuwaitKyrgyz RepublicLao PDRLate-demographic dividendLatin America & Caribbean Latin America & Caribbean (excluding high income)Latin America & the Caribbean (IDA & IBRD countries)LatviaLeast developed countries: UN classificationLebanonLesothoLiberiaLibyaLiechtensteinLithuaniaLow & middle incomeLow incomeLower middle incomeLuxembourgMacao SAR, ChinaMacedonia, FYRMadagascarMalawiMalaysiaMaldivesMaliMaltaMarshall IslandsMauritaniaMauritiusMexicoMicronesia, Fed. Sts.Middle East & North AfricaMiddle East & North Africa (excluding high income)Middle East & North Africa (IDA & IBRD countries)Middle incomeMoldovaMonacoMongoliaMontenegroMoroccoMozambiqueMyanmarNamibiaNauruNepalNetherlandsNew CaledoniaNew ZealandNicaraguaNigerNigeriaNorth AmericaNorthern Mariana IslandsNorwayOECD membersOmanOther small statesPacific island small statesPakistanPalauPanamaPapua New GuineaParaguayPeruPhilippinesPolandPortugalPost-demographic dividendPre-demographic dividendPuerto RicoQatarRomaniaRussian FederationRwandaSamoaSan MarinoSao Tome and PrincipeSaudi ArabiaSenegalSerbiaSeychellesSierra LeoneSingaporeSint Maarten (Dutch part)Slovak RepublicSloveniaSmall statesSolomon IslandsSomaliaSouth AfricaSouth AsiaSouth Asia (IDA & IBRD)South SudanSpainSri LankaSt. Kitts and NevisSt. LuciaSt. Martin (French part)St. Vincent and the GrenadinesSub-Saharan Africa Sub-Saharan Africa (excluding high income)Sub-Saharan Africa (IDA & IBRD countries)SudanSurinameSwazilandSwedenSwitzerlandSyrian Arab RepublicTajikistanTanzaniaThailandTimor-LesteTogoTongaTrinidad and TobagoTunisiaTurkeyTurkmenistanTurks and Caicos IslandsTuvaluUgandaUkraineUnited Arab EmiratesUnited KingdomUnited StatesUpper middle incomeUruguayUzbekistanVanuatuVenezuela, RBVietnamVirgin Islands (U.S.)West Bank and GazaWorldYemen, Rep.ZambiaZimbabwe Timeline:
This timeline shows a graph from 1961 to 2016 of Solomon Islands. No data until 1960. Number of actual observations by date: 56.
Source name:
World Development Indicators
Source organization:
(1) United Nations Population Division. World Population Prospects, (2) Census reports and other statistical publications from national statistical offices, (3) Eurostat: Demographic Statistics, (4) United Nations Statistical Division. Population and Vital Statistics Report (various years), (5) U.S. Census Bureau: International Database, and (6) Secretariat of the Pacific Community: Statistics and Demography Programme.
Categories, topics:
Climate Change, Health
Last updated:
apr 23, 2017
Indicators value changes by year
Minimum:
117.869K
jan 1, 1961
Maximum:
583.591K
jan 1, 2016
At the date of observation
Value
Absolute change
Change from previous value
jan 1, 1961
117.869K
+117.869K
0.0%
jan 1, 1962
121.403K
+3.534K
3.0%
jan 1, 1963
125.068K
+3.665K
3.02%
jan 1, 1964
128.863K
+3.795K
3.03%
jan 1, 1965
132.787K
+3.924K
3.05%
jan 1, 1966
136.847K
+4.06K
3.06%
jan 1, 1967
141.027K
+4.18K
3.05%
jan 1, 1968
145.354K
+4.327K
3.07%
jan 1, 1969
149.926K
+4.572K
3.15%
jan 1, 1970
154.876K
+4.95K
3.3%
jan 1, 1971
160.292K
+5.416K
3.5%
jan 1, 1972
166.214K
+5.922K
3.69%
jan 1, 1973
172.599K
+6.385K
3.84%
jan 1, 1974
179.354K
+6.755K
3.91%
jan 1, 1975
186.338K
+6.984K
3.89%
jan 1, 1976
193.447K
+7.109K
3.82%
jan 1, 1977
200.642K
+7.195K
3.72%
jan 1, 1978
207.942K
+7.3K
3.64%
jan 1, 1979
215.353K
+7.411K
3.56%
jan 1, 1980
222.905K
+7.552K
3.51%
jan 1, 1981
230.614K
+7.709K
3.46%
jan 1, 1982
238.488K
+7.874K
3.41%
jan 1, 1983
246.502K
+8.014K
3.36%
jan 1, 1984
254.602K
+8.1K
3.29%
jan 1, 1985
262.719K
+8.117K
3.19%
jan 1, 1986
270.809K
+8.09K
3.08%
jan 1, 1987
278.846K
+8.037K
2.97%
jan 1, 1988
286.868K
+8.022K
2.88%
jan 1, 1989
294.962K
+8.094K
2.82%
jan 1, 1990
303.258K
+8.296K
2.81%
jan 1, 1991
311.849K
+8.591K
2.83%
jan 1, 1992
320.764K
+8.915K
2.86%
jan 1, 1993
329.984K
+9.22K
2.87%
jan 1, 1994
339.49K
+9.506K
2.88%
jan 1, 1995
349.25K
+9.76K
2.87%
jan 1, 1996
359.236K
+9.986K
2.86%
jan 1, 1997
369.438K
+10.202K
2.84%
jan 1, 1998
379.859K
+10.421K
2.82%
jan 1, 1999
390.489K
+10.63K
2.8%
jan 1, 2000
401.319K
+10.83K
2.77%
jan 1, 2001
412.336K
+11.017K
2.75%
jan 1, 2002
423.535K
+11.199K
2.72%
jan 1, 2003
434.893K
+11.358K
2.68%
jan 1, 2004
446.352K
+11.459K
2.63%
jan 1, 2005
457.841K
+11.489K
2.57%
jan 1, 2006
469.306K
+11.465K
2.5%
jan 1, 2007
480.716K
+11.41K
2.43%
jan 1, 2008
492.075K
+11.359K
2.36%
jan 1, 2009
503.41K
+11.335K
2.3%
jan 1, 2010
514.767K
+11.357K
2.26%
jan 1, 2011
526.177K
+11.41K
2.22%
jan 1, 2012
537.648K
+11.471K
2.18%
jan 1, 2013
549.162K
+11.514K
2.14%
jan 1, 2014
560.685K
+11.523K
2.1%
jan 1, 2015
572.171K
+11.486K
2.05%
jan 1, 2016
583.591K
+11.42K
2.0%
Ranking of countries by current statistics by years


Comments: